Download
1 / 15
150 likes | 397 Views
Power Grid Stability in Small World Perspective. Charles Kim Department of Electrical and Computer Engineering Howard University September 25-27, 2006 CRIS2006 Third International Conference on Critical Infrastructures. Power Grid and Dynamic Analysis. Complex Network

E N D
Power Grid Stability in Small World Perspective Charles Kim Department of Electrical and Computer Engineering Howard University September 25-27, 2006 CRIS2006 Third International Conference on Critical Infrastructures
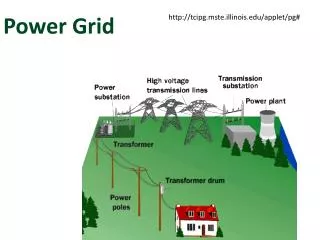
Power Grid and Dynamic Analysis • Complex Network • Long Distance Transmission • Interconnection • System Stability by State Equation (First order Differential equation) and Eigenvalue Analysis: Matrix A • Stable • Unstable • Planning Tool used as operational tool
Causes and Problems • Major Blackouts • WSCC 1996, Northeast 2003 • Common Causes • Equipment Failure • Vegetation Problem • Human Error • But No Single Cause • Problems (according to report) • No specific cause singled out • Assumption and conditions in the dynamic analysis • Relationships between network topology and system dynamics recognized but not realized
Another Angle Complementary Tool • Topological analysis of power grid • Investigation of relatedness with topology and cascading failure • Random (or intentional) removal of nodes (generators, substation, etc) or transmission lines. • Removal of the lines faulted in the actual failure in the order of event • Topological Changes • Providing an alternative operational (warning) tool for system operators • Graphical Perspective of Blackouts and Major outages
Graph Theory • Number of nodes (n) • Size – Number of edges (M) • Degree (k) • Critical Path Length (L) • Shortest path distance between two nodes • Clustering Coefficient (g) • The degree to which neighboring nodes are connected to each other • 3 types of network • Regular • Random • Small World
“Small World” Network • A small world graph is any graph with a relatively small L and a relatively large g. • Small World Criteria: L is close to Lrandom {~ ln(n) / ln(k)} g is much greater than grandom {~ k / n} • Characteristics that make the small world phenomenon interesting: • The network is large • The network is sparse – people (or things) are connected to a small fraction of the total network • The network is decentralized -- no single (or small #) of stars • The network is highly clustered -- most friendship circles are overlapping • globally significant changes can result from locally insignificant network change
Small World and Dynamics • Topology affects dynamics • Small world topology enhances signal propagation • The dynamics are very non-linear -- with no clear pattern based on local connectivity. • Diseases move more slowly in highly clustered graphs • small local changes (shortcuts) can have dramatic global outcomes (disease diffusion) • Infection of a whole population (an example) • Regular Graph:5 steps • Random Graph:3 steps • Small World:3 steps
Graph Analysis of Power Grids • Larger networks are small world networks
Is it relevant? • Some Recent Findings & Suggestions • The density of shortcut edges is an important factor in determining the probability of large-size epidemics, or failures. • Networks with a very high density of shortcut edges exhibit primarily large-size failures. • Networks with no shortcut edges tend to have only small-size failures. • Thus, the presence of a few shortcut edges greatly increases the probability of large-size failures. • Removing tie lines from power systems is obviously impractical, but monitoring and protection strategies could be employed to reduce the chance of disturbance propagation and cascading failures. • Other Related Articles • “Model for Cascading Failures in Complex Networks” PHYSICAL REVIEW E 69, 045104(R), (2004) • “Dynamics of Small World Networks and Vulnerability of the Electric Power Grid”, 8th Symposium of Specialist in Electric Operational and Expansion Planning), Brazil, May 2002 • “Cascade Control and Defense in Complex Networks” Phys. Rev. Lett. 93, 098701(2004) • “Network Models: Growth, Dynamics, and Failure” Proceedings of the 34th Hawaii International Conference on System Sciences-2001 • “Cascading Failure Analysis of Bulk Power System Using Small World Network Model” 8th International Conference on Probabilistic Methods Applied to Power Systems, Iowa State University, Ames, Iowa, September, 2004
Graphical Property Changes in the Scenarios g • the critical path lengths for the July outage scenarios show much higher than those of other scenarios including the no-outage scenario. • a little increase in the path of the two August outage scenarios.
Conclusions and Remarks • the preliminary results shown in this section do not directly answer the hypothesis of topological changes vs. cascading failures. • The comparison of the scenarios is not complete. The sequential event (or line removal) and its effect to the critical path length and the clustering coefficient were not performed. • Furthermore, the preliminary study was performed on reduced size grid of the WSCC grid. • However, the preliminary results shed some insight in that they could relate the cascading outages to static topological measures, along with the dynamic indices that were traditionally used in a power operation modeling. • further investigation is in need for the possible correlation of the topological measures to cascading outages. • The basic method for this feasibility study is to graphically analyze all North American powergrids that experienced major outages for a possible representation of a grid in terms of topology for its operational and stability status.