Download

1 / 67
800 likes | 1.5k Views
Meteorology: every day weather. Dr. Anne Clouser National Earth Sciences Committee. Meteorology: Everyday Weather. Everyday Weather: is the first topic in the B-Division Science Olympiad Meteorology Event.

E N D
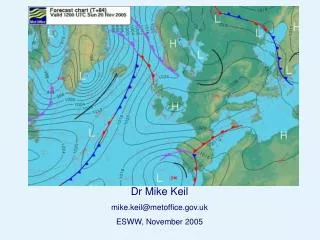
Meteorology: every day weather Dr. Anne Clouser National Earth Sciences Committee
Meteorology: Everyday Weather • Everyday Weather: is the first topic in the B-Division Science Olympiad Meteorology Event. • Topics: rotate annually so a middle school participant may receive a comprehensive course of instruction in meteorology during the three-year cycle. • Sequence: • Everyday Weather (2007) • Severe Storms (2008) • Climate (2009)
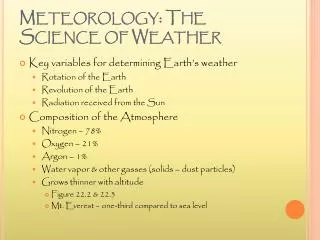
topics to be covered • The modern atmosphere: structure and composition • Water: its states and properties as they relate to weather • Clouds and precipitation: types, and how they are formed • Heat transport: the energy budget, insolation, albedo, convection, radiation, etc. • Atmospheric circulation: Coriolis effect, planetary wind belts, jet streams, local wind patterns (Chinook winds, mountain and sea breezes), and the three cell model of circulation • Air Masses: origin, temperature, density, moisture content, and stability • Highs, lows, and fronts (warm, cold, occluded & stationary) • Surface Weather Stations: how to read and interpret them • Modern weather technology: satellite imagery, isobars and isotherms, surface weather maps showing isobars fronts and radar data, meteograms, stuve diagrams, and doppler imagery. • Weather instrumentation: barometers, thermometers, anemometers, sling psychrometers, rain gauges, radiosondes, rawinsondes, and the Beaufort scale • Atmospheric phenomena: sundogs, rainbows, aurora, virga, etc.
THE MODERN ATMOSPHERE • ITS COMPOSITION • There are permanent gasses (nitrogen and oxygen) • There are variable gasses (carbon dioxide, methane, water vapor, ozone, particulates • The composition of the atmosphere has not been constant but has changed through time. • We used to be the stuff of stars (helium and hydrogen) but outgassing, comets, UV radiation and photosynthesis have changed us. • http://www.uwsp.edu/gEo/faculty/ritter/geog101/textbook/atmosphere/atmospheric_structure.html • http://www.physicalgeography.net/fundamentals/7a.html • http://www.visionlearning.com/library/module_viewer.php?mid=107&l=&c3= • http://www.globalchange.umich.edu/globalchange1/current/lectures/samson/evolution_atm/index.html#evolution
THE MODERN ATMOSPHERE • IT’S STRUCTURE • Layers are defined by temperature, altitude, and unique characteristics • There are layers where temperature rises with altitude or falls with altitude (our natural instinct). • Between these layers there are pauses where temperature is constant with altitude change. • Each layer has unique characteristics like 90% of the ozone is in the stratosphere and gasses stratify by molecular weight in the thermosphere • Thickness of these layers varies with latitude. • http://www.uwsp.edu/gEo/faculty/ritter/geog101/textbook/atmosphere/atmospheric_structure.html • http://www.albany.edu/faculty/rgk/atm101/structur.htm
water: its states and properties • Water is unique in that it can exist in three states on the face our planet liquid, solid, and gas • Water absorbs or releases huge amounts of latent heat as it changes states. This is unique. It buffers our environment with this capacity. • Water is most dense at 4oC so ice floats otherwise the oceans would freeze from the bottom up. No life on earth. • Water is the universal solvent • http://www.uwsp.edu/geo/faculty/ritter/geog101/textbook/atmospheric_moisture/phase_changes.html • http://en.wikipedia.org/wiki/Latent_heat
PRECIPITATION • When cloud particles become too heavy to remain suspended in the air, they fall to the earth as precipitation. Precipitation occurs in a variety of forms; hail, rain, freezing rain, sleet or snow. • http://ga.water.usgs.gov/edu/watercycleprecipitation.html • http://www.laits.utexas.edu/kimmel/container.html?precip_types.html&2 • http://ww2010.atmos.uiuc.edu/(Gh)/guides/mtr/cld/prcp/home.rxml
PRECIPITATION: RAIN • Rainfall:Rain develops when growing cloud droplets become too heavy to remain in the cloud and as a result, fall toward the surface as rain. • Rain can also begin as ice crystals that collect each other to form large snowflakes. As the falling snow passes through the freezing level into warmer air, the flakes melt and collapse into rain drops. • The picture below shows heavy rain falling over the Grand Canyon. • http://homepage.ntlworld.com/booty.weather/metinfo/precipform.htm • http://ww2010.atmos.uiuc.edu/(Gh)/guides/mtr/cld/prcp/rnhl.rxml • http://www.infoplease.com/ce6/weather/A0840995.html • http://www.aolsvc.worldbook.aol.com/wb/Article?id=ar458340 • http://www.ess.uci.edu/~yu/class/ess5/Chapter.7.precipitation.all.pdf#search=%22hail%20formation%20by%20coalescence%22
PRECIPITATION: HAIL • Hail: Hail is a large frozen raindrop produced by intense thunderstorms, where snow and rain can coexist in the central updraft. • As the snowflakes fall, liquid water freezes onto them forming ice pellets that will continue to grow as more and more droplets are accumulated. • Upon reaching the bottom of the cloud, some of the ice pellets are carried by the updraft back up to the top of the storm. As the ice pellets once again fall through the cloud, another layer of ice is added and the hail stone grows even larger. • Typically the stronger the updraft, the more times a hail stone repeats this cycle and consequently, the larger it grows. Once the hail stone becomes too heavy to be supported by the updraft, it falls out of the cloud toward the surface. • http://www.classzone.com/books/earth_science/terc/content/visualizations/es1805/es1805page01.cfm?chapter_no=visualization • http://www.mcwar.org/articles/hail.pdf#search=%22hail%20formation%20by%20coalescence%22 • http://www.islandnet.com/~see/weather/almanac/arc2002/alm02jul.htm • http://beta.nssl.noaa.gov/primer/hail/hail_basics.html
PRECIPITATION: FREEZING RAIN • FREEZING RAIN: The diagram below shows a typical temperature profile for freezing rain with the red line indicating the atmosphere's temperature at any given altitude. • The vertical line in the center of the diagram is the freezing line. Temperatures to the left of this line are below freezing, while temperatures to the right are above freezing. Freezing rain develops as falling snow encounters a layer of warm air deep enough for the snow to completely melt and become rain. • As the rain continues to fall, it passes through a thin layer of cold air just above the surface and cools to a temperature below freezing. However, the drops themselves do not freeze, a phenomena called supercooling (or forming "supercooled drops"). • When the supercooled drops strike the frozen ground (power lines, or tree branches), they instantly freeze, forming a thin film of ice, hence freezing rain. • http://twister.sbs.ohio-state.edu/g520/ch7_1.ppt#16 • http://www.islandnet.com/~see/weather/elements/icestorm.htm • http://ww2010.atmos.uiuc.edu/(Gh)/guides/mtr/cld/prcp/zr/prcs/ice.rxml
PRECIPITATION: SLEET • SLEET: Sleet is less prevalent than freezing rain and is defined as frozen raindrops that bounce on impact with the ground or other objects. • The diagram at the right shows a typical temperature profile for sleet with the red line indicating the atmosphere's temperature at any given altitude. • The vertical line in the center of the diagram is the freezing line. • Temperatures to the left of this line are below freezing, while temperatures to the right are above freezing. • http://ww2010.atmos.uiuc.edu/(Gh)/guides/mtr/cld/prcp/slt.rxml • http://www.weatherquestions.com/What_causes_ice_pellets.htm • http://www.geography.hunter.cuny.edu/~tbw/wc.notes/5.cond.precip/sleet_formation.htm
PRECIPITATION: SNOW • SNOW: Snowflakes are simply aggregates of ice crystals that collect to each other as they fall toward the surface. • The diagram below shows a typical temperature profile for snow with the red line indicating the atmosphere's temperature at any given altitude. The vertical line in the center of the diagram is the freezing line. Temperatures to the left of this line are below freezing, while temperatures to the right are above freezing. • Since the snowflakes do not pass through a layer of air warm enough to cause them to melt, they remain in tact and reach the ground as snow. • http://ww2010.atmos.uiuc.edu/(Gh)/guides/mtr/cld/prcp/snow.rxml • http://www.geography.hunter.cuny.edu/~tbw/wc.notes/5.cond.precip/sleet_formation.htm • http://web.syr.edu/~wrt405/normal/snow.html • http://express.howstuffworks.com/wq-snowstorm.htm • http://library.thinkquest.org/C003603/english/snowstorms/index.shtml
CLOUDS: FORMATION • FORMATION: Clouds are formed when air containing water vapor is cooled below a critical temperature called the dew point and the resulting moisture condenses into droplets on microscopic dust particles (condensation nuclei) in the atmosphere. • Expansional cooling: The air is normally cooled by expansion during its upward movement. As a parcel of air rises it is cooled by expansion and makes clouds • Upward flow of air in the atmosphere may be caused by convectionresulting from intense solar heating of the ground, again expansional cooling. • by a cold wedge of air (cold front) near the ground causing a mass of warm air to be forced aloft, frontal lifting or convergence. • by a mountain range at an angle to the wind, orographic uplift. Again expansional cooling • Frictional turbulence: Clouds are occasionally produced by a reduction of pressure aloft or by the mixing of warmer and cooler air currents. • http://www.infoplease.com/ce6/weather/A0857399.html • http://www.physicalgeography.net/fundamentals/8e.html • http://www.auf.asn.au/meteorology/section3.html • http://www.bbc.co.uk/weather/weatherwise/factfiles/basics/clouds_formation.shtml
CLOUDS: CLASSIFICATION Cirrus: high clouds that do not obscure the sun or moon but often create halos. High cloud forms include cirrus, detached clouds of delicate and fibrous appearance, generally white in color, often resembling tufts or featherlike plumes, and composed entirely of ice crystals; cirrocumulus (mackerel sky), composed of small white flakes or very small globular masses, arranged in groups, lines, or ripples; and cirrostratus, a thin whitish veil, sometimes giving the entire sky a milky appearance, which does not blur the outline of the sun or moon but frequently produces a halo. Alto: intermediate clouds. Intermediate clouds include altocumulus, patchy layer of flattened globular masses arranged in groups, lines, or waves, with individual clouds sometimes so close together that their edges join; and altostratus, resembling thick cirrostratus without halo phenomena, like a gray veil, through which the sun or the moon shows vaguely or is sometimes completely hidden.
CLOUDS: CLASSIFICATION Stratus: low clouds. Low clouds include stratocumulus, a cloud layer or patches composed of fairly large globular masses or flakes, soft and gray with darker parts, arranged in groups, lines, or rolls, often with the rolls so close together that their edges join; stratus, a uniform layer resembling fog but not resting on the ground; and nimbostratus, a nearly uniform, dark grey layer, amorphous in character and usually producing continuous rain or snow. Cumulus: clouds with vertical development. A thick, detached cloud, generally associated with fair weather, usually with a horizontal base and a dome-shaped upper surface that frequently resembles a head of cauliflower and shows strong contrasts of light and shadow when the sun illuminates it from the side, and cumulonimbus, the thunderstorm cloud, heavy masses of great vertical development whose summits rise in the form of mountains or towers, the upper parts having a fibrous texture, often spreading out in the shape of an anvil, and sometimes reaching the stratosphere. Cumulonimbus generally produces showers of rain, snow, hailstorms, or thunderstorms.
unique cloud types: know what they mean Nacreous clouds:These rare clouds, sometimes called mother-of-pearl clouds, are 15 - 25km (9 -16 miles) high in the stratosphere and well above tropospheric clouds. They are iridescent clouds. They occur mostly but not exclusively in polar regions and in winter at high latitudes. They shine brightly in high altitude sunlight up to two hours after ground level sunset or before dawn. Their unbelievably bright iridescent colours and slow movement relative to any lower clouds make them an unmistakable and unforgettable sight. Mammatus clouds:these clouds are formed by down pouchings of cold air. Mammatus typically develop on the underside of a thunderstorm's anvil and can be a remarkable sight, especially when sunlight is reflected off of them.
unique cloud types: know what they mean • Noctilucent clouds: Clouds at extremely high altitude, about 85 km, that literally (as the name suggests) shine at night. They form in the cold, summer polar mesopause and are believed to be ice crystals. Because of their high altitude, in a very dry part of the atmosphere, noctilucent clouds are rather an enigma and are being studied by a number of people around the world. Lenticular clouds: Altocumulus standing lenticularus result from strong wind flow over rugged terrain. Jet stream winds whipping over the Rockies produce up-and-down wavelike patterns on the lee side of the range. Lenticular clouds, which occur at mid-levels of the troposphere form at the peaks of these waves. These eerie, elliptical cloud formations, which can also resemble stacks of pancakes, often foretell changes in the weather, and indicate high winds aloft.
unique cloud types: know what they mean • Wave clouds: Kelvin-Helmholtz wave clouds are formed when there are two parallel layers of air that are usually moving at different speeds and in opposite directions. The upper layer of air usually moves faster than the lower layer because there is less friction. In order for us to see this shear layer, there must be enough water vapor in the air for a cloud to form. Even if clouds are not present to reveal the shear layer, pilots need to be aware of invisible atmospheric phenomenon. Cap clouds: A mountain top is sometimes capped by a more or less smooth cloud. This cap cloud is related to lenticularis, but forms directly over the mountaintop as opposed to lenticularis, that may form at middle altitudes above the mountain. A cap cloud is formed when humid air is forced to flow over the mountain, condensing into a cloud.
heat transport and energy budget • Absorption and re-emission of radiation at the earth's surface is only one part of an intricate web of heat transfer in the earth's planetary domain. Equally important are selective absorption and emission of radiation from molecules in the atmosphere. If the earth did not have an atmosphere, surface temperatures would be too cold to sustain life. If too many gases which absorb and emit infrared radiation were present in the atmosphere, surface temperatures would be too hot to sustain life. • http://okfirst.ocs.ou.edu/train/meteorology/EnergyBudget2.html • http://marine.rutgers.edu/mrs/education/class/yuri/erb.html#dosh
Insolation: intensity and duration The amount of insolation received at the Earth’s surface is a function of the intensity and duration of the radiation. Intensity and duration are directly impacted by latitude as illustrated by the graph below.
Earth’s Energy Budget: Earth’s external heat engine is energy provided by the sun Average global surface temperature = 15°C This temperature represents the balance between Incoming solar radiation (insolation) the whole electromagnetic spectrum and outgoing terrestrial radiation (infrared radiation or long wave) earth’s energy budget
earth’s energy budget • Three atmospheric processes modify the solar radiation passing through our atmosphere destined to the Earth's surface. • The process ofscatteringoccurs when small particles and gas molecules diffuse part of the incoming solar radiation in random directions without any alteration to the wavelength of the electromagnetic energy. Scattering does, however, reduce the amount of incoming radiation reaching the Earth's surface. A significant proportion of scattered shortwave solar radiation is redirected back to space. • The amount of scattering that takes place is dependent on two factors: wavelength of the incoming radiation and the size of the scattering particle or gas molecule. • In the Earth's atmosphere, the presence of a large number of particles with a size of about 0.5 microns results in shorter wavelengths being preferentially scattered. This factor also causes our sky to look blue because this color corresponds to those wavelengths that are best diffused. If scattering did not occur in our atmosphere the daylight sky would be black. • http://www.physicalgeography.net/fundamentals/7f.html
earth’s energy budget • Absorption: If intercepted, some gases and particles in the atmosphere have the ability to absorb incoming insolation . Absorption is defined as a process in which solar radiation is retained by a substance and converted into heat energy. The creation of heat energy also causes the substance to emit its own radiation. In general, the absorption of solar radiation by substances in the Earth's atmosphere results in temperatures that get no higher than 1800° Celsius. Bodies with temperatures at this level or lower would emit their radiation in the longwave band. Further, this emission of radiation is in all directions so a sizable proportion of this energy is lost to space.
earth’s energy budget • Reflection: The final process in the atmosphere that modifies incoming solar radiation is reflection. Reflection is a process where sunlight is redirected by 180° after it strikes an atmospheric particle. This redirection causes a 100 % loss of the insolation. Most of the reflection in our atmosphere occurs in clouds when light is intercepted by particles of liquid and frozen water. The reflectivity of a cloud can range from 40 to 90 %.
earth’s energy budget: albedo • Sunlight reaching the Earth's surface unmodified by any of the above atmospheric processes is termed direct solar radiation. Solar radiation that reaches the Earth's surface after it was altered by the process of scattering is called diffusedsolar radiation. Not all of the direct and diffused radiation available at the Earth's surface is used to do work (photosynthesis, creation of sensible heat, evaporation, etc.). As in the atmosphere, some of the radiation received at the Earth's surface is redirected back to space by reflection. The image to the right describes the spatial pattern of surface reflectivity as measured for the year 1987 • The reflectivity or albedo of the Earth's surface varies with the type of material that covers it. For example, fresh snow can reflect up to 95 % of the insolation that reaches it surface. Some other surface type reflectivities are: • Dry sand 35 to 45 % • Broadleaf deciduous forest 5 to 10 % • Needle leaf coniferous forest 10 to 20 % • Grass type vegetation 15 to 25 % • Reflectivity of the surface is often described by the term surfacealbedo. The Earth's averagealbedo, reflectance from both the atmosphere and the surface, is about 30 %.
In the three cell model, the equator is the warmest location on the Earth and acts as a zone of thermal lows known as the Intertropical convergence zone(ITCZ). The ITCZ draws in surface air from the subtropics and as it reaches the equator, it rises into the upper atmosphere by convergence and convection. It attains a maximum vertical altitude of about 14 kilometers (top of the troposphere), then begins flowing horizontally to the North and South Poles. Coriolis force causes the deflection of this moving air, and by about 30° of latitude the air begins to flow zonally from west to east. ATMOSPHERIC CIRCULATION: PLANETARY WINDS AND CORIOLIS
This zonal flow is known as the subtropical jet stream. The zonal flow also causes the accumulation of air in the upper atmosphere as it is no longer flowing meridionally. To compensate for this accumulation, some of the air in the upper atmosphere sinks back to the surface creating the subtropical high pressure zone. From this zone, the surface air travels in two directions. A portion of the air moves back toward the equator completing the circulation system known as the Hadley cell. This moving air is also deflected by the Coriolis effect to create the Northeast Trades (right deflection) and Southeast Trades (left deflection). ATMOSPHERIC CIRCULATION: PLANETARY WINDS AND CORIOLIS
The surface air moving towards the poles from the subtropical high zone is also deflected by Coriolis acceleration producing the Westerlies. Between the latitudes of 30 to 60° North and South, upper air winds blow generally towards the poles. Once again, Coriolis force deflects this wind to cause it to flow west to east forming the polar jet stream at roughly 60° North and South. On the Earth's surface at 60° North and South latitude, the subtropical Westerlies collide with cold air traveling from the poles. This collision results in frontal uplift and the creation of the subpolar lows or mid-latitude cyclones. A small portion of this lifted air is sent back into theFerrel cell after it reaches the top of the troposphere. Most of this lifted air is directed to the polar vortex where it moves downward to create the polar high. http://www.physicalgeography.net/fundamentals/7p.html ATMOSPHERIC CIRCULATION: PLANETARY WINDS AND CORIOLIS
Air masses • Air masses tend to be homogeneous in nature. The two critical properties of any air mass are: • 1. Temperature • 2. Moisture • The point of origin of an air mass will determine temperature and moisture content. Combined these properties produce the weather we experience daily. • http://www.ecn.ac.uk/Education/air_masses.htm • http://okfirst.ocs.ou.edu/train/meteorology/AirMasses.html
Air masses • An air mass is a huge volume of air that covers hundreds of thousands of square kilometers that is relatively uniform horizontally and vertically in both temperature and humidity • The characteristics of an air mass are determined by the surface over which they form so they are either continental or maritime indicated with a lower case m or c • Then they are classed as Arctic, Polar, Tropical or Equitorial (A, P, T, or E) • And finally they have a lower case k or w at the end to indicate whether they are warmer or colder than the land over which they are moving. • Note that arctic and polar are difficult to distinguish as are tropical and equatorial. • Air masses are driven by the prevailing winds. Hot air originates near the equator and cold near the poles and the middle latitudes where we live is the mixing zone and we have spectacular weather as warm and cold air masses work their way across us.
highs lows and fronts High pressure system is an anticyclone Highs generally have good weather and when seen from above surface winds surrounding a high blow in a clockwise direction and outward from the high Lows and highs track with the prevailing winds from west to east across the US Low pressure system is a cyclone Lows tend to have cloudy bad weather and when seen from above surface winds surrounding a low blow in a counter clockwise direction and inward to the low. Lows and highs track with the prevailing winds from west to east across the US
highs lows and fronts • As air masses collide carrying their characteristics of temperature and moisture they create fronts, warm, cold, stationary and occluded. Each have unique vertical characteristics with characteristic weather patterns.
Warm fronts • Warm fronts tend to move slowly • They carry broad bands of clouds that begin high and drop lower with time. • They tend to be associated with light and prolonged rains and warming temperatures • A warm front is defined as the transition zone where a warm air mass is replacing a cold air mass. Warm fronts generally move from southwest to northeast and the air behind a warm front is warmer and more moist than the air ahead of it. When a warm front passes through, the air becomes noticeably warmer and more humid than it was before. • Symbolically, a warm front is represented by a solid line with semicircles pointing towards the colder air andin the direction of movement.
cold fronts • A cold front is defined as the transition zone where a cold air mass is replacing a warmer air mass. Cold fronts generally move from northwest to southeast. The air behind a cold front is noticeably colder and drier than the air ahead of it. When a cold front passes through, temperatures can drop more than 15 degrees within the first hour. • Cold fronts tend to be associated with vertical clouds and rains of short duration but often with intensity. • There is typically a noticeable temperature change from one side of a cold front to the other. In the map of surface temperatures right, the station east of the front reported a temperature of 55 degrees Fahrenheit while a short distance behind the front, the temperature decreased to 38 degrees. An abrupt temperature change over a short distance is a good indicator that a front is located somewhere in between. • Symbolically, a cold front is represented by a solid line with triangles along the front pointing towards the warmer air and in the direction of movement. On colored weather maps, a cold front is drawn with a solid blue line.
Stationary fronts • When a warm or cold front stops moving, it becomes a stationary front. Once this boundary resumes its forward motion, it once again becomes a warm front or cold front. A stationary front is represented by alternating blue and red lines with blue triangles pointing towards the warmer air and red semicircles pointing towards the colder air. • A noticeable temperature change and/or shift in wind direction is commonly observed when crossing from one side of a stationary front to the other
Occluded fronts • A developing cyclone typically has a preceding warm front (the leading edge of a warm moist air mass) and a faster moving cold front (the leading edge of a colder drier air mass wrapping around the storm). North of the warm front is a mass of cooler air that was in place before the storm even entered the region. • As the storm intensifies, the cold front rotates around the storm and catches the warm front. This forms an occluded front, which is the boundary that separates the new cold air mass (to the west) from the older cool air mass already in place north of the warm front. Symbolically, an occluded front is represented by a solid line with alternating triangles and circles pointing the direction the front is moving. On colored weather maps, an occluded front is drawn with a solid purple line. • Changes in temperature, dew point temperature, and wind direction can occur with the passage of an occluded front. • A noticeable wind shift also occurred across the occluded front. East of the front, winds were reported from the east-southeast while behind the front, winds were from the west-southwest.
Warm or cold occluded fronts Cold occlusion A colder air mass advances on a cold air mass and occludes warmer air. Warm occlusion A warmer air mass advances on a cold air mass and occludes warmer air.
surface weather stations: precipitaton • A weather symbol is plotted if at the time of observation, there is either precipitation occurring or a condition causing reduced visibility. Below is a list of the most common weather symbols:
surface weather stations: wind • Wind is plotted in increments of 5 knots (kts), with the outer end of the symbol pointing toward the direction from which the wind is blowing. • The wind speed is determined by adding up the total of flags, lines, and half-lines, each of which have the following individual values: flag: 50 kts, Line: 10 kts, Half-Line: 5 kts. • Wind is always reported as the direction from which it is coming. • If there is only a circle depicted over the station with no wind symbol present, the wind is calm. Below are some sample wind symbols:
surface weather stations: pressure and trend • PRESSURESea-level pressure is plotted in tenths of millibars (mb), with the leading 10 or 9 omitted. For reference, 1013 mb is equivalent to 29.92 inches of mercury. Below are some sample conversions between plotted and complete sea-level pressure values:410: 1041.0 mb103: 1010.3 mb987: 998.7 mb872: 987.2 mb • PRESSURE TRENDThe pressure trend has two components, a number and symbol, to indicate how the sea-level pressure has changed during the past three hours. The number provides the 3-hour change in tenths of millibars, while the symbol provides a graphic illustration of how this change occurred. Below are the meanings of the pressure trend symbols:
surface weather stations: sky cover • The amount that the circle at the center of the station plot is filled in reflects the approximate amount that the sky is covered with clouds. To the right are the common cloud cover depictions
weather technology: early instrumentation • Thermometer • Device used to measure temperature. • Temperature • Temperature is defined as the measure of the average speed of atoms and molecules. The higher the temperature the faster they move • . Barometer Instrument that measures atmosphericpressure. Atmospheric PressureWeight of the atmosphere on a surface. At sea-level, the average atmospheric pressure is 1013.25 millibars. Pressure is measured by a device called a barometer.
weather technology: early instrumentation Anemometer used to measure wind speed. These instruments commonly employee three methods to measure this phenomenon: 1) speed of rotation, 2) pressure plate to measure force of wind 3) a heated wire that measures heat loss from wind http://www.arm.ac.uk/annrep/annrep2000/node13.html • Sling PsychrometerPsychrometerthat uses a rotating handle and a whirling motion to ventilate its wet-bulb thermometer. • Wet-Bulb Thermometer has a moisten wick on its reservoir bulb. When ventilated this thermometer records a temperature that is modified by the cooling effects of evaporation. This measurement and the temperature reading from a dry-bulb thermometerare then used to determine the air's relative humidityor dew pointfrom a psychrometric table. • http://www.geography.hunter.cuny.edu/~tbw/wc.notes/4.moisture.atm.stability/psychrometer.htm
weather technology: early instrumentation Rain gauge - This type of rain gauge counts water droplets of known volume as they pass an optical sensor. Rain from the main collector funnels directly into a small reservoir chamber, which maintains a critical water level within the system. As the level increases, excess water flows out through a horizontal pipe, so that drops form from a precision tube. This tube produces drops of a specific, pre-determined volume. By equating the volume of water passing the sensor in a given time with the collecting area, researchers can estimate the rainfall rate. Remote access weather stations…new technology combined with old instrumentation reporting weather remotely around the united states. Acronym is RAWS
weather technology: radiosondes and rawinsondes • Before the use of satellites we used radiosondes and rawinsondes to collect important information about our atmosphere. These instruments are still used today and provide valuable information about atmospheric conditions. • http://www.aos.wisc.edu/~hopkins/wx-inst/wxi-raob.htm • http://www.geo.mtu.edu/department/classes/ge406/cmriley/ • http://www.meso.com/wind-personal/glenn/171/Stuve2a.htm • The radiosonde is a balloon-borneinstrument platform with radio transmitting capabilities. • The radiosonde contains instruments capable of making direct in-situ measurements of air temperature, humidity and pressure with height, typically to altitudes of approximately 30 km. • A rawinsonde (or radio wind sonde) is a radiosonde package with an attached radar reflector that permits radio-direction finding equipment to determine the wind direction and wind speed at various altitudes during the ascent of the package.
weather technology: rawinsonde Stuve Diagrams are one type of thermodynamic diagram used to represent or plot atmospheric data as recorded by weather balloons in their ascent through the atmosphere. The data the balloons record are called soundings. Rawinsonde tracking unit http://www.csun.edu/~hmc60533/CSUN_103/weather_exercises/soundings/smog_and_inversions/Understanding%20Stuve_v3.htm