Download
1 / 7
70 likes | 225 Views
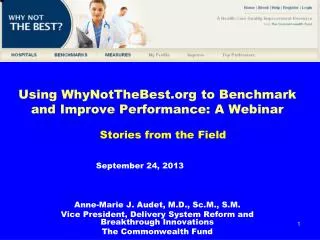
Using WhyNotTheBest.org to Benchmark and Improve Performance: A Webinar. Stories from the Field. Anne-Marie J. Audet, M.D., Sc.M ., S.M . Vice President, Delivery System Reform and Breakthrough Innovations The Commonwealth Fund. September 24, 2013. Learning Objectives.

E N D
Using WhyNotTheBest.org to Benchmark and Improve Performance: A Webinar Stories from the Field Anne-Marie J. Audet, M.D., Sc.M., S.M. Vice President, Delivery System Reform and Breakthrough Innovations The Commonwealth Fund September 24, 2013
Learning Objectives 1. Overview of WhyNotTheBest.org, one of six national quality reporting and benchmarking sites – with 11,100 registered users • Whose quality is reported • What measures of quality are reported • Sources of data 2. Live demo • How to create reports • Visualizing performance: Maps 3. Examples from “power users” • OSF HealthCare (Health System) • ECG Management Consultants (Health Care Consultancy) • Health Research and Educational Trust (American Hospital Association research arm)
What Is WhyNotTheBest.org? • December 2008 launch at the IHI Annual Forum • WhyNotTheBest.org addresses a health system reform strategy: public reporting and ease of access to performance data as lever to raise benchmarks and achieve high-quality, efficient care. Site was created to fill a unique niche: • Provide health care leaders with easily accessible, standardized public data on organization-level performance : • How are we doing over time? • How are we doing compared to the benchmark, to others like us? • Provider Resource. Most performance reporting sites target consumers; WhyNotTheBest.org is designed for health care providers and leaders to stimulate and support their quality improvement strategies. • Transparent and aligned with national standards. Compared to numerous ranking and scoring sites • Measure methodologies are transparent and in public domain • Site provide resources for improvement
Who Uses WhyNotTheBest.org? • Audiences: Chief Executive Officers, Chief Medical and Quality Officers, Chiefs of Nursing, Chief Information Officers; Data Analytic Experts, private-sector performance assessment groups, business coalitions. • Tool used to prepare reports for hospital boards, train staff in process improvement, compare quality across markets or regions, track progress. • Recommended as one of top hospital profiling sites by Wall Street Journal and featured in health blogs: ABC News, WSJ, and US News and World Report. • Included as resource for HHS Value Exchange Networks. • Veterans Administration outreach to Fund re: design of its own performance reporting site. • Partnerships with 18 states, Consumer Reports, and The Leapfrog Group in reporting patient safety data.
What’s Unique About WNTB? Scope of Measures, Benchmarks, and Flexibility in Generating Reports • Hospital quality: 30 Hospital Quality Alliance measures • Patient experiences: 10 measures from the Hospital Consumer Assessment of Healthcare Providers and Systems (HCAHPS) • Incidence of central line–associated bloodstream infections from 3,780 hospitals • All-payer data from 18 states: AHRQ Patient Safety Indicators, Prevention Quality Indicators, and Inpatient Quality Indicators • Rates of health information technology adoption: AHA survey • Population health and utilization/costs: Institute of Medicine Providers Profiled • Over 5,335 hospitals • Over 400 multi-hospital systems Geographic visualization of performance • Interactive maps of national, state, county, and HRR-level performance • Map overlays of delivery system reform – PCMHs, CVEs, Beacons Improvement Resources and Wide Range of Benchmarking Capabilities • 65 Health care delivery improvement tools • 57 Case studies • Allows users to compare against “others like me” – safety net, teaching hospitals, hospital systems; to others in their region, to top 1%, 10%, 25%, national average
WhyNotTheBest.org What Does it Include?
Resources www.commonwealthfund.org www.Whynotthebest.org