Download
1 / 24
240 likes | 344 Views
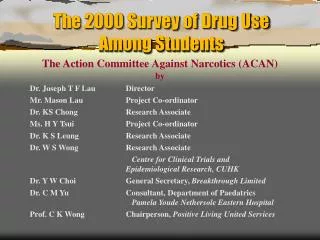
Overview of 2000 Survey of TB Drug Supply Experiences in Low- and Middle-Income WHO Member States Diana Weil Senior Public Health Specialist World Bank/United States. Appreciation.

E N D
Overview of 2000 Survey of TB Drug Supply Experiences in Low- and Middle-Income WHO Member States Diana Weil Senior Public Health Specialist World Bank/United States
Appreciation With appreciation to National TB Control Program Managers, Ariel Pablos-Mendes and the Rockefeller Foundation, the World Bank, Lauren Mueenuddin, Rajedra Shukla, Mario Raviglionne, Jacob Kumaresan, Arata Kochi, Christy Hanson, Fabio Luelmo, Dan Bleed, Richard Laing, Peter Evans, Ian Smith, WHO regional offices and representatives, KNCV, and IUATLD and Dr. Pierre Chaulet
National TB Drug Supply Experiences, 1999–2000 Survey Objectives • Inform Stop TB and DOTS expansion efforts • Provide evidence base for assessment of need for a Global TB Drug Facility • Provide background information on public tender market for the “pharmacoeconomics analysis” for the GATD
Approach • Modified version of 1992 WHO survey (see Weil, in TB: Back to the Future, 1993), focusing on full drug cycle • Distributed through WHO regional offices & the Africa IUATLD 2000 meeting to NTP managers or counterparts • Used online and hard copy formats (online responses minimal) • Allowed online entry of database • Performed first analyses 2000/2001—GDF prospectus • Performed price analysis 2002 • Reported all results based on respondents’ answers, without independent validation
1992 74 respondents 31/45 AFRO 14/36 AMRO 9/22 EMRO 5/11 SEARO 15/23 WPRO 2000 75 respondents 27 AFRO 16 AMRO 12 EMRO 13 EURO 3 SEARO 4 WPRO* *Only 4 high-burden WPRO countries asked for responses. 17 of 22 high-burden countries Two Surveys
Drug Planning: Percentage of NTPs That *29% past year consumption; 40% past year TB cases; 27% estimated TB cases
Percentage of NTPs Responsible for Preparing Estimated Budget for TB Drugs,1992 and 2000 Average
Percentage of NTPs That Have Secure Financing for 2001: TB Drug Needs vs. 1992 Results
Percentage of NTPs with One or More Reported National-level TB Drug Stock Out: 1999 vs. 1992
Proportion of $115 Million Reported Public TB Drug Purchasing, by Region Note: A number of major countries are missing from the database.
Estimated $120–$145 Million Annual Sales through Public Tender Market Source: Economics of TB Drug Development, GATDD, 2002.
Percentage of NTPs Using Open International Tendering for at Least Some Drug Purchases
Percentage of Countries with National Mechanisms for Drug Quality Control, 1992 and 2000 * Note: No question 1992 on measurement of the quality of quality control
Percentage of NTPs with TB Drug Distribution Using a “Pull” Approach (Based on Requests Received from Districts)
Percentage of NTPs Stating TB Drugs are Free-of-Charge to Patients in Health Services
Percentage of NTPs Reporting That Private Sales of TB Drugs Are Restricted
Conclusions • NTPs are more involved in the drug supply cycle. (But what about training & time burden?) • Drug financing is still too often insecure. • Average prices are low, but there are inefficient outliers caused by lack of competitive tendering. • Use of fixed-drug combinations has increased. • Quality control is still feeble.
Revisiting Recommendations from 1993 Survey AnalysisThere is progress! • Increasing awareness of governments, donors, and producers of burden & C/E of control to increase financing and production + • Training NTP staff in drug management + • Fostering collaboration to develop new procurement mechanisms that increase availability of financing and volume of orders, and reduce delays in procurement and supply +++ • Disseminating treatment guidelines so that rational use of drugs is improved +++ • Conducting research to develop new drugs, depot preparations, and regimens that increase ease of drug administration, reduce length of regimen, and reduce risk of spreading drug-resistant strains ++