Download
1 / 21
210 likes | 521 Views
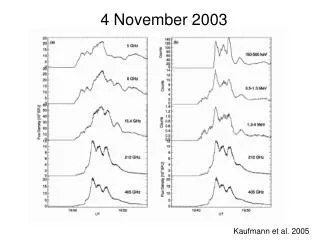
3 November 2003 event. HXR/Gamma-ray and radio observations. Rhessi_workshop. 3 November 2003 event. GOES X 3.9 (AR 0488) Observed in X-rays (keV-a few MeV (RHESSI) (Liu, Jiang, Liu et al, 2004; Veronig, Karlicky, Vrsnak et al. 2005)

E N D
3 November 2003 event HXR/Gamma-ray and radio observations Rhessi_workshop
3 November 2003 event • GOES X 3.9 (AR 0488) • Observed in X-rays (keV-a few MeV (RHESSI) • (Liu, Jiang, Liu et al, 2004; Veronig, Karlicky, Vrsnak et al. 2005) • Observed at m/dm wavelengths by the Nançay Radioheliograph • (150 MHz-450 MHz) and at cm/mm wavelengths by Bern (16 GHz-89 GHz) and by RSTN • (Dauphin, Vilmer, Lüthi et al, 2005) • (Dauphin, Vilmer, Krucker, 2006)
60-150 keV 20-25 keV 03 novembre 2003 3 November 2003 event From Liu et al, 2004 2 parts for the non-thermal emission FP sources at 60-150 keV LT at 20-25 keV
3 November 2003 event Foot point separation increases between first and second peak Loop top source rises in the corona between first and second peak Liu et al, 2004
X-rays Phoenix radio Type II OSRA Type III like Wind/waves Large band continuum Enhancement and modulations (radio and X-rays) Also a fast CME Seen by Lasco
3 November 2003 event • Broad band modulations at X-ray and mm-cm to dm wavelengths: origin? • Rising soft X-ray loop and CME? • Rising X-ray loop and type II onset at high frequencies • Link between HXR/GR emitting electrons and mm/cm emitting electrons
Broad-band modulations X-rays Mm/cm Bern obs Type II Type III Dm/m NRH Details of the modulations
Radio spectrum: Combination of plasma emissions and of gyrosynchrotron emissions plasma From 09:56:30 continuous rise of the Radio spectrum from 400 MHz to several 10 GHz Origin of dm/m radio continua??: Gyrosynchrotron emission of a few MeV electrons (Boischot/Denisse 1957) Plasma emissions (Duncan, 1981; Trottet et al,1981) gyrosynchrotron Here: gyrosynchrotron emission: Combined radio spectrum 1 first part 2 before modulations 3 four modulations to 09:59:50 UT 4 fifth modulation from 10:00:00 UT Adjustment between NRH and RSTN at 410 MHz No adjustement with Bern
3 November 2003 No evidence of lines In part 1 Part 2: 2.2 MeV line Look at the continuum Search for Flattening at high energies
Link between HXR/GR and cm/mm emitting electrons HXR/GR spectra Note the flattening of the photon spectrum above 400 keV-600 keV Spectral index:-2.1 and -1.6
More details… • We first look at rear detectors and we started to bin with binning 12: • Detectors 2 and 7 excluded (no pulse pile up correction) • 1 keV width 3 to 60 keV • 2 keV to 120 keV • 5 keV to 250 keV • 10 keV to 2250 keV • 50 keV 2250 to 7200 keV • 200 keV 7.2 MeV to 17 MeV • + special binning around 511 keV and 2.2 MeV • Results: • Interval 1 : 094901-094957 UT • A@50 keV=8.25 1= -3.4 Eb= 396 keV 2= -2.2 • 2= 0.85 • We also note the presence of a 511kev and a 2.2 MeV line
Same analysis with a different binning: binning 13 with larger energy bins since we are not really interested by lines Binning 13: 129 channels: 1 kev width to 3 keV 2 keV to 100 keV 5 keV to 150 keV 10 keV to 200 keV 20 keV to 300 keV 50 keV to 600 keV 100 keV to 1000 keV 200 keV to 1600 keV 300 keV to 2500 keV 500 keV to… + 20 keV channel around 511 keV +50 keV channel around 2.2 MeV Results: Interval 1 : 094902-095002 UT A@50 keV=7.19 1= -3.3 Eb= 408 keV 2= -2.1 2= 0.7 We marginally see the 2.2 MeV line. There is a good consistency with the parameters obtained with binning 12 With this binning, we better see that the signal is above the background .
Interval2: Results: Interval 2 : 095850-100130 UT A@50 keV=3.5 1= -3.2 Eb= 597 keV 2= -1.6 2= 1.09 We also see the 511 keV? and 2.2 MeV lines The spectrum flattens at low energies below 200 kev (the fit is done above 180 keV) . The slope is similar between 200 keV and the break energy is larger compared to the first peak The slope is flatter above the break than in the first peak. The signal is a bit above the background
With Binning 13: Results: Interval 2 : 095850-100130 UT A@50 keV=3.1 1= -3.18 Eb= 619 keV 2= -1.56 2= 2.32 Only the 2.2 MeV line is seen The results are consistent with the ones of binning 12
Add the 2.2 MeV line Other lines?
Simple relationship between the spectral indexes of cm-mm and HXR/GR producing electrons Microwave from trapped electrons X-ray emission (thick target From precipitating electrons • If HXR photon spectral index: • Thick-target emitting electrons : precipitating flux F: X= +1 • Relationship between F and N in the loop: F=N ( time spent in the loop) • If free streaming of relativistic electrons or turbulent trapping: E0 • : index of microwave radiation: =1.22-0.9 with spectral index of electrons in the loop
Link between HXR/GR and cm/mm emitting electrons Note the flat spectrum between 50 and 89 GHz What is the relationship between HXR/GR and cm/mm emitting Electrons??
3 November event The predicted spectral index of Gyrosynchrotron emissions would be -1.6 to -1.12 if emitted by the hardest part of the electron population Seems too steep… What about numbers?