Download
1 / 8
90 likes | 407 Views
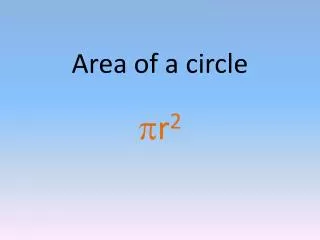
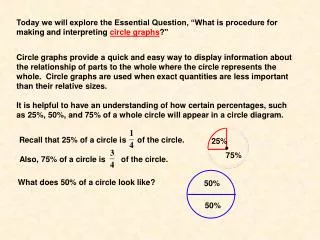
Also, 75% of a circle is of the circle. 50%. 50%. Today we will explore the Essential Question, “What is procedure for making and interpreting circle graphs ?".

E N D
Also, 75% of a circle is of the circle. 50% 50% Today we will explore the Essential Question, “What is procedure for making and interpreting circle graphs?" Circle graphs provide a quick and easy way to display information about the relationship of parts to the whole where the circle represents the whole. Circle graphs are used when exact quantities are less important than their relative sizes. It is helpful to have an understanding of how certain percentages, such as 25%, 50%, and 75% of a whole circle will appear in a circle diagram. Recall that 25% of a circle is of the circle. 25% 75% What does 50% of a circle look like?
Nike 10% Pepsi 15% Exxon 40% Coca-Cola 15% Apple 20% 50 Example 1: An investor owns 50 shares of stock in the various companies that are shown in the circle graph. How many shares of Exxon stock does he own? Stocks Owned What percent of the investor’s stocks are Exxon? What is the total number of shares of stock the investor owns? 40% 40% of 50 = 0.4(50) = 20 The investor owns 20 shares of Exxon stock. In the next example, we will create our own circle graph. When creating a circle graph we need to determine the following: • The total number of items represented by the circle. • The number of different parts in the circle. • The percentage each part is of the whole. Then we will be able to draw the circle graph with each part representing the proper percentage of the circle. Label each section and include a title.
Example 2: Create a circle graph that shows the percentages of each brand of shoes sold at a particular store in December using the data in the given table. Explain how the percentages are obtained. • How many are represented by the whole circle? 150 + 192 + 60 + 108 + 90 = 600 5 • How many different parts will there be? • What percentage is each part of the whole? To determine the percentage a part is of the whole, divide the number of the item sold by the total and multiply by 100 to change the decimal to a percent. Reebok: Adidas: Puma: Nike: Other:
Adidas: Nike: Reebok: Puma: Other: Sneakers Sold in December Other 15% Adidas 25% Puma 18% Nike 32% Reebok 10% Use the percentages to divide the circle into 5 parts. The part representing Adidas is 1/4 of the circle because 25% is equal to 1/4. The part representing Nike is more than 1/4 of the circle. The remaining portion of the circle is divided into 3 parts such that Puma is the largest part of the 3 parts, Other is the next largest, and Reebok is the smallest part. Don’t forget to label each section and include a title. The problem asked us to explain how the percentages are obtained. They are obtained by finding the sum and dividing each individual value by the sum.
The table below shows the electricity production by source for the state of Florida in 1993 and 1995. (The kilowatt hours are in billions.) Use this table for problems 1 and 2. 1. Make a circle graph that shows the energy sources in percent for 1995. • How many kilowatt hours are represented by the whole circle? 61.9 + 34.3 + 17.9 + 25.9 = 140 • How many different parts will there be? 4 Electricity by Source 1995 • What percentage is each part of the whole? 13% Gas (Slightly less than 1/2 of the circle) 44% Coal 18.5% Nuclear (about 1/4 of the circle) 24.5% Petroleum (the smallest portion) (a little larger than the smallest portion) Give the graph a title.
2. What percentage of electricity production was from gas in 1993? Find the total kilowatt hours for 1993. 61.9 + 21.6 + 34.8 + 28.7 = 147 Find the correct number in the table. Determine the percentage by dividing:
Fast Food Restaurant Preferences Burger King 30% McDonalds 55% Wendy's 12% Other 3% 3. Wendy surveyed the seniors at her high school to determine their choices in fast food restaurants. The results of the survey of 500 students are shown in the circle graph. How many students prefer to eat at McDonalds? 500 What percent of the students prefer McDonalds? 55% How many were surveyed? 0.55 (500) = 275 Find 55% of 500. 275 seniors prefer McDonalds. 4. Using the same survey as problem 3, how many students preferred neither McDonalds, nor Burger King, nor Wendy's? What percent preferred neither McDonalds, nor Burger King, nor Wendy’s? 3% 0.03 (500) = 15 Find 3% of 500. 15 seniors preferred neither McDonalds, nor Burger King, nor Wendy’s.
0-17 15% Over 65 20% 18-40 30% 41-65 35% Independent Practice Problems: The 2000 census broke down the population of a small town into age categories as shown in the table. (a) Create a circle graph that shows the percentages of each age group using the data in the given table. 375 + 750 + 875 + 500 =2500 2000 Census in Small Town (b) Explain how the percentages are obtained. Find the sum and divide each individual value by the sum.