Download

1 / 21
220 likes | 308 Views
Explore how NRL leverages EDCNet & DigitalPT for quality monitoring of nucleic acid tests, EQAS, QC, specificity tracking, and more. Discover IT implications and benefits for laboratories worldwide.

E N D
Monitoring the Performance of Nucleic Acid Tests using Data Generated from EDCNet and DigitalPT Wayne Dimech, Darren Jardine, Thu-Anh Pham and the staff of the NRL
Presentation Outline • NRL’s ever-widening role in QA • Why Internet-based technology (IT) • IT implications and examples for: • External quality assessment schemes (EQAS) • Quality control (QC) programmes • Specificity monitoring • Summary - effective quality monitoring
NRL’s Ever-widening Role in QA • Monitors the performance of in vitro diagnostic (IVD) reagents for BBV in Australia including nucleic acid testing (NAT) • Provides quality assurance internationally (200+ laboratories) • Extending collaborations with like organisations • Developing IT to support its client laboratories
Why Internet-based Technology • Standardise data collection and storage • Manage increasing data complexity • Improve maintenance of data • Offer better statistical analyses • Give instant feedback to laboratories to ensure their ability to monitor performance • Individualise reporting • Offer easy administration of QA functions • Offer international accessibility • Facilitate international collaborations
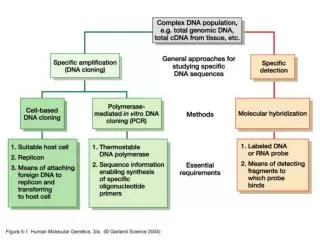
NAT EQAS Design • EQAS for NAT are designed to examine • Limits of detection • Inter- and intra-run variability • Contamination/carry over • Inhibition • Instrument/method variability • Develop QC samples • Geno-subtype detection
IT Implications on NAT EQAS • NAT EQAS concepts in DigitalPT • Assay • Test Process • Kit • Instrument • Analyte • Unit
DigitalPT Concepts Laboratory Assay Extraction Amplification Detection Kit Kit Kit Technique Technique Technique Kit: Roche MagNA Pure LC TNA Isolation Kit Instrument: MagNA Pure Instrument Instrument Instrument Kit: Roche COBAS Amplicor HIV-1 Monitor v 1.5 Instrument: COBAS Amplicor Kit: Roche COBAS Amplicor HIV-1 Monitor v 1.5 Instrument: COBAS Amplicor Analyte Analyte Units
IT Implications on Quality Control • Collects, stores and analyses QC data • Allows for inter-laboratory comparisons • Requires peer groups for assessment of accuracy • Can monitor imprecision and bias • Can identify sources of variation
Quality Control Information • Data collected can be used to • Monitor reagent batches • Troubleshoot laboratory problems • Provide oversight of regional laboratories • Review QC sample stability • Collect information for assay standardisation • Calculate uncertainty of measurement
Chlamydia NAT QC Programme • Roche COBAS Amplicor Chlamydia • QC sample produced by NRL • 18 month period • 15 laboratories, 28 instruments • 3,570 observations; • CV (%) of all results = 9.14% • CV (%) ranged from 4.31 - 16.12%
Chlamydia NAT QC Summary Laboratory C: CV(%) COBAS 5 5.96 COBAS 4 6.19 COBAS 2 9.95 COBAS 1 10.51 COBAS 3 12.00 Mean: 3.52 to 3.86 287 18
Blood screening NAT QC Summary • Three Chiron TMA assays monitored • Period of 15 months • 21 laboratories, 31 instruments • Two batches of QC samples for each analyte (HBV, HCV and HIV) • More than 16,000 data entries
Chiron TMA - Duplex Results of two batches of AcroMetrix PeliSpy Pro samples tested in the Chiron Duplex TMA Assays HCV HIV A B A B QC sample batches
Chiron TMA - Ultrio Results of two batches of AcroMetrix PeliSpy Pro samples tested in theChiron ULTRIO TMA Assays HCV HIV HBV A B A B A B QC sample batches
HCV HIV HBV A B A B A B QC sample batches Chiron TMA - TIGRIS Results of two batches of AcroMetrix PeliSpy Pro samples tested in theChiron TIGRIS TMA Assays
IT Implications on Specificity Monitoring • Collects and analyses the initial (IRR) and repeat reactor rates (RRR) and compares them with confirmed positive rate • Monitors assay and laboratory performance • Increase in IRR may indicate contamination • Results may be analyzed in conjunction with QC results
Conclusion • Internet technology allows: • More complex data collection and analysis • Standardisation of data collection • International participation • Greater scalability • Facilitation of collaboration • Immediate feed back to oversight bodies and manufactures on assay performance