Download
1 / 47
470 likes | 585 Views
Mounting Pressures Facing the U.S. Workforce and the Increasing Need for Adult Education and Literacy. Patrick J. Kelly National Center for Higher Education Management Systems. 100. 25 to 34 Year Olds. 90. 45 to 54 Year Olds. 80. 70. 60.

E N D
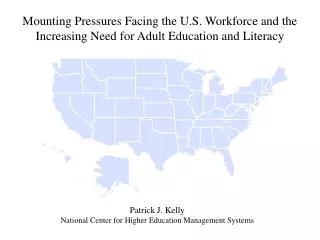
Mounting Pressures Facing the U.S. Workforce and the Increasing Need for Adult Education and Literacy Patrick J. KellyNational Center for Higher Education Management Systems
100 25 to 34 Year Olds 90 45 to 54 Year Olds 80 70 60 The United States ranks 11th among OECD countries in the percentage of young adults with a high school diploma – the only country in which the younger adults are less educated than the previous generation. 50 40 30 20 10 0 Italy Japan Spain Korea France Poland Ireland Greece Iceland Austria Finland Mexico Turkey Norway Canada Sweden Belgium Portugal Germany Hungary Australia Denmark Switzerland Netherlands Luxembourg United States New Zealand Czech Republic Slovak Republic United Kingdom Percentage of Adults with at Least a High School Diploma by Age-Group 2004 Source: Organisation for Economic Cooperation and Economic Development, 2006 Education at a Glance
25-34 35-44 45-54 55-64 97.0 100 95.5 94.0 94.0 93.7 93.6 92.8 92.1 91.4 90.9 90.6 89.7 89.4 88.7 88.7 88.0 87.6 87.2 87.1 86.7 86.4 86.2 86.3 86.1 85.9 84.3 84.1 83.4 83.2 82.2 82.0 80.8 78.9 77.6 77.5 80 75.9 72.8 70.6 69.3 65.0 64.0 58.6 57.2 60 40 33.8 20 0 Korea Norway Japan Slovak Czech Sweden Canada Finland Switzerland Austria United Republic Republic States Percent of Adults with a High School Diploma by Age-Group – The U.S. and Leading OECD Countries (2004) Source: Organisation of Economic Cooperation and Development, Education at a Glance 2005
60 25 to 34 50 45 to 54 40 30 20 10 0 Italy Spain Japan Korea Poland Mexico Greece Austria Finland Ireland Iceland France Turkey Norway Belgium Canada Sweden Portugal Germany Hungary Australia Denmark Switzerland Netherlands Luxembourg New Zealand United States Czech Republic Slovak Republic United Kingdom Differences in College Attainment (Associate and Higher) Between Young and Older Adults – The U.S. and OECD Countries, 2004 Source: Organisation of Economic Cooperation and Development, Education at a Glance 2006
Percent of Adults with an Associates Degree or Higher by Age-Group – The U.S. and Leading OECD Countries (2004) 25-34 35-44 45-54 55-64 60 53.3 51.6 49.1 50 47.0 45.1 42.3 41.4 40.7 40.7 40.4 39.4 39.2 39.0 40 36.2 35.7 34.5 34.1 33.5 32.9 32.7 32.3 29.4 28.9 30 27.3 25.2 23.2 21.5 20.0 19.2 20 16.4 15.7 9.7 10 0 Canada Japan Korea Sweden Belgium Ireland Norway United States Source: Organisation of Economic Cooperation and Development, Education at a Glance 2005
Short-Term On-the-Job Training (No Formal Award) 11.4% Moderate-Term On-the-Job Training (No Formal Award) 8.5% Long-Term On-the-Job Training (No Formal Award) 8.7% Work Experience in Related Occupation (No Formal Award) 9.6% Postsecondary Vocational Award 17.7% Associates Degrees 25.1% Bachelor's Degree 19.6% Postsecondary Degree Plus Work Experience 16.6% Masters Degree 18.8% Doctorate Degree 30.8% Professional Degree 19.0% 0% 7% 14% 21% 28% 35% Changing Workforce Needs: The Projected Percentage Employment Growth in the U.S. from 2004 to 2014 by Level of Education Required Source: U.S. Bureau of Labor Statistics
Changing Workforce Needs: The Projected Number Employment Growth in the U.S. from 2004 to 2014 by Level of Education Required (In Thousands) Short-Term On-the-Job 5,891 Training (No Formal Award) Moderate-Term On-the-Job 2,473 Training (No Formal Award) Long-Term On-the-Job 960 Training (No Formal Award) Work Experience in Related 1,057 Occupation (No Formal Award) Employment Requiring Some Level of 8,526 Postsecondary Education 0 2,000 4,000 6,000 8,000 10,000 Source: U.S. Bureau of Labor Statistics
100 Participating in the Workforce Not Participating in the Workforce 87.6 84.6 82.7 79.3 80 73.0 60 56.8 43.2 40 27.0 20.7 20 17.3 15.4 12.4 0 Less than HS High School Some College Associate Bachelor's Graduate/Prof. Participation in the Workforce by Level of Education, 2000 (Percent) Source: Integrated Public Use Microdata Series 5% sample, www.ipums.org
Projected Change in U.S. Population by Age and Race/Ethnicity From 2000 to 2020 (In Millions) White African-American Hispanic /Latino Asian /Pacific Islander 15 12.40 The majority of expected growth in our young population from 2000 to 2020 is among segments of our population that have the lowest levels of education – while whites are projected to decline. 10 7.32 7.12 6.50 5.49 5 3.69 2.97 2.79 2.29 2.03 1.87 1.57 1.41 1.20 1.11 0.42 0.33 0 0 to 17 18 to 24 25 to 44 45 to 64 65 and Older -0.88 -1.83 -5 -6.59 Note: Projections based on the 2000 Census are not available for Native Americans -10 Source: US Census Bureau, Population Projections based on the 2000 Decennial Census
100% 78.4% 80% 69.3% 68.8% 64.6% 62.5% 61.8% 58.2% 60% 57.4% 54.5% 47.8% 45.8% 39.7% 40% 36.5% 32.7% 31.1% 30.3% 28.6% 24.3% 20% Not Available 0% Graduating from High Attending College Directly Three-Year Graduation Rate Six-Year Graduation Rate at School Within Four Years Out of High School at Two-Year Colleges Four-Year Colleges Transition and Completion Measures from High School to College Completion for the U.S. – 2004 White Roughly half of Hispanics and African-Americans don’t complete high school within four years. African-American Hispanic /Latino Native American Asian /Pacific Islander Source: National Center for Education Statistics; Common Core Data, Digest of Education Statistics, and IPEDS Graduation Rate Survey
8,000,000 Given current educational attainment disparities by race/ethnicity and projected changes in the population, it is likely that the segment of our population with less than a high school diploma will grow more than any other – unless successful intervention takes place. Less than High School 7,378,402 High School Some College Associates 6,000,000 Bachelor’s Graduate/Professional 4,834,077 4,000,000 3,656,845 2,368,743 2,000,000 1,382,160 1,096,163 0 Source: NCHEMS, As America Becomes More Diverse: The Impact of State Higher Education Inequality Number Changes in Educational Attainment from 2000 to 2020 as a Result of the Projected Changes in Race/Ethnicity (25 to 64 Year Olds)
Target Populations • Adults with no high school diplomas (or equivalent) • High school only completers unprepared for the workforce or to enter college (the best proxy we have – those whose family incomes are less than a living wage) • English as a Second Language (ESL) – with less than a high school diploma (or equivalent) or just a high school diploma • Incarcerated population
25% 19.8% 18.9% 18.8% 20% 17.6% 17.1% 16.9% 16.9% 16.6% 16.2% 15.9% 15.8% 15.8% 15.5% 15.5% 14.6% 14.2% 14.1% 15% 13.8% 13.6% 13.6% 13.3% 13.3% 13.1% 13.0% 12.7% 12.5% 12.2% 12.2% 11.7% 11.4% 11.3% 11.3% 11.0% 10.8% 10.3% 10.3% 10.2% 10.1% 9.9% 9.6% 9.4% 9.4% 9.3% 10% 8.9% 8.9% 8.8% 8.4% 8.3% 8.1% 8.0% 7.8% 6.9% 5% 0% Utah Ohio Iowa Idaho Texas Maine Alaska Illinois Florida Hawaii Kansas Indiana Oregon Nevada Arizona Georgia Virginia Vermont Missouri Montana Alabama Arkansas Colorado Nebraska Delaware Michigan Kentucky Maryland Louisiana Wyoming California Tennessee Oklahoma New York Wisconsin Minnesota Dist of Col Mississippi New Jersey Washington Connecticut New Mexico Rhode Island Pennsylvania United States South Dakota North Dakota West Virginia Massachusetts South Carolina North Carolina New Hampshire Percent of Adults 18 to 64 Year Old with Less than a High School Diploma (or Equivalent) 2005 Source: US Census Bureau, 2005 American Community Survey
30% 25.2% 24.9% 24.1% 25% 23.5% 23.5% 23.1% 23.1% 22.4% 22.3% 22.3% 22.0% 22.0% 21.5% 20.9% 20.8% 20.6% 20.5% 20.4% 19.7% 19.6% 19.6% 19.6% 19.5% 19.2% 19.2% 19.1% 18.8% 18.7% 20% 18.0% 17.9% 17.9% 17.6% 17.6% 17.5% 17.3% 17.1% 17.0% 16.9% 16.2% 16.2% 16.0% 16.0% 15.9% 15.8% 15.8% 15.6% 15.5% 15.4% 15.3% 14.4% 15% 11.9% 10% 8.3% 5% 0% Utah Ohio Iowa Idaho Texas Maine Alaska Illinois Florida Hawaii Kansas Indiana Oregon Nevada Georgia Arizona Virginia Vermont Missouri Montana Alabama Arkansas Colorado Nebraska Delaware Michigan Kentucky Maryland Louisiana Wyoming California Oklahoma Tennessee New York Minnesota Wisconsin Dist of Col Mississippi New Jersey Washington Connecticut New Mexico Rhode Island Pennsylvania United States South Dakota North Dakota West Virginia Massachusetts North Carolina South Carolina New Hampshire Percent of Adults 18 to 24 Year Old with Less than a High School Diploma (or Equivalent) 2005 Source: US Census Bureau, 2005 American Community Survey
Distribution (%) of Residents 18 to 64 with Less than a High School Diploma by Grade-Level Completed and State, 2005 9th to 12th Grade (No Completion) 5th to 8th Grade Less than 5th Grade No School 100% 80% 60% 40% 20% 0% Utah Iowa Ohio Idaho Texas Maine Alaska Illinois Kansas Hawaii Florida Oregon Indiana Nevada Arizona Georgia Virginia Missouri Vermont Montana Alabama Arkansas Colorado Nebraska Delaware Michigan Kentucky Maryland Louisiana Wyoming California Tennessee Oklahoma New York Minnesota Wisconsin Dist of Col Mississippi New Jersey Washington Connecticut New Mexico Rhode island Pennsylvania United States South Dakota North Dakota West Virginia Massachusetts North Carolina South Carolina New Hampshire Source: US Census Bureau, 2005 American Community Survey Note: Excludes 18 to 24 year olds enrolled in school
3,000,000 2,579,656 U.S. = 8,339,734 2,400,000 1,800,000 1,274,890 1,200,000 661,822 572,991 600,000 405,061 291,011 266,011 204,657 160,927 159,443 137,938 131,889 117,677 117,279 108,092 88,618 86,029 74,434 68,428 62,005 59,181 55,941 50,621 48,540 47,318 46,692 45,469 43,355 39,898 33,692 32,805 31,263 29,476 28,453 26,823 26,484 23,803 20,758 17,203 14,747 14,360 10,684 6,469 4,344 4,326 3,425 2,840 589 516 465 336 0 Utah Ohio Iowa Idaho Texas Maine Alaska Illinois Florida Hawaii Kansas Oregon Indiana Nevada Arizona Georgia Virginia Vermont Missouri Montana Alabama Colorado Arkansas Nebraska Michigan Delaware Maryland Kentucky Louisiana Wyoming California Tennessee Oklahoma New York Minnesota Wisconsin Dist of Col Mississippi New Jersey Washington Connecticut New Mexico Rhode island Pennsylvania South Dakota North Dakota West Virginia Massachusetts South Carolina North Carolina New Hampshire Number of Residents Ages 18 to 64 Who Speak English Poorly or Not at All by State, 2005 Source: US Census Bureau, 2005 American Community Survey
4,500,000 3,997,270 U.S. = 8,339,734 3,000,000 2,459,145 1,883,319 1,500,000 696,499 530,690 269,852 204,856 0 Less than 9th 9th to 12th High School Some Associate Bachelor's Graduate or Grade Grade (No College Professional Diploma) Number of U.S. Residents Ages 18 to 64 Who Speak English Poorly or Not at All by Level of Education Completed, 2005 Source: US Census Bureau, 2005 American Community Survey
4,500,000 3,707,705 U.S. = 28,770,543 3,038,986 3,000,000 1,761,945 1,723,791 1,500,000 1,090,711 1,089,271 1,034,744 1,001,589 973,247 843,119 789,126 629,606 611,202 611,190 595,907 588,529 568,872 555,734 542,814 514,962 498,705 432,751 410,267 395,163 394,303 382,354 365,538 338,720 337,262 289,130 265,229 255,476 242,116 228,546 218,909 189,630 170,458 151,810 131,886 121,427 84,571 76,359 75,638 70,149 69,587 66,142 54,387 58,646 47,705 40,862 33,767 0 Utah Ohio Iowa Idaho Texas Maine Alaska Illinois Florida Hawaii Kansas Indiana Oregon Nevada Georgia Arizona Virginia Vermont Missouri Montana Alabama Arkansas Colorado Nebraska Michigan Delaware Kentucky Maryland Louisiana Wyoming California Tennessee Oklahoma New York Wisconsin Minnesota Dist of Col Mississippi New Jersey Washington Connecticut New Mexico Rhode island Pennsylvania South Dakota North Dakota West Virginia Massachusetts North Carolina South Carolina New Hampshire Number of Residents Ages 18 to 64 with Just a High School Diploma or Less in Families with Incomes Below a Living Wage* by State, 2005 * 200% of Poverty Level Source: US Census Bureau, 2005 American Community Survey
Number of U.S. Residents Ages 18 to 64 in Families with Incomes Below a Living Wage by Education Level Completed, 2005 18,000,000 15,801,210 15,000,000 U.S. = 28,770,543 12,000,000 9,000,000 8,050,077 7,144,389 6,000,000 4,919,256 2,765,001 3,000,000 2,030,729 887,438 0 Less than 9th 9th to 12th High School Some College Associates Bachelor's Graduate and Grade Grade (No Diploma Professional Diploma) Source: US Census Bureau, 2005 American Community Survey
Proportion of Residents Ages 18 to 64 in Families with Incomes Below a Living Wage Within Each Education Attainment Category, 2005 80% 61.0% 60% 46.5% 40% 29.9% 20% 17.5% 14.5% 8.9% 5.5% 0% Less than 9th 9th to 12th High School Some College Associates Bachelor's Graduate and Grade Grade (No Diploma Professional Diploma) Source: US Census Bureau, 2005 American Community Survey
Adult Education and Literacy: Target Population in 2005 18 to 64 Year Olds, 2005 Target Population (Exclusive Categories) ESL: High School Diploma Only or Less – No or Poor Ability to Speak English 8,339,734 Not Prepared for College or Work: High School Diploma Only, In Families Earning Less than a Living Wage (Not ESL) 14,494,128 Target Population 42,357,936 (23.5%) 138,127,986 No High School Diploma or Equivalent (Not ESL) 19,524,074 Note: Incarcerated population not separated out. All of the above categories include incarcerated individuals. Sources: US Census Bureau, 2005 American Community Survey: Public Use Microdata Samples
35 ESL: High School Diploma Only or Less, No or Poor Ability to Speak English 32.4 High School Diploma, Earning Less than a Living Wage (Not ESL) 30.5 30.3 29.9 29.7 Less than a High School Diploma or Equivalent (Not ESL) 29.3 30 29.0 28.9 28.2 27.5 27.2 27.1 26.3 25.9 25.9 25.8 24.6 25 24.2 23.5 23.1 22.9 22.9 22.7 21.9 21.5 21.2 21.2 20.9 20.8 20.2 20.1 20.0 19.6 19.4 20 18.8 18.7 18.6 18.4 18.4 17.9 17.9 17.5 17.4 17.3 16.9 16.8 16.2 16.1 15.9 15.0 15 13.6 13.6 10 5 0 Utah Ohio Iowa Idaho Texas Maine Alaska Illinois Florida Kansas Hawaii Indiana Oregon Nevada Arizona Georgia Virginia Missouri Montana Vermont Alabama Arkansas Colorado Nebraska Michigan Delaware Kentucky Maryland Louisiana Wyoming California Tennessee Oklahoma New York Wisconsin Minnesota Dist of Col Mississippi New Jersey Washington Connecticut New Mexico Rhode island United States Pennsylvania South Dakota North Dakota West Virginia Massachusetts South Carolina North Carolina New Hampshire Adult Education and Literacy: Target Populations as a Percentage of all 18 to 64 Year Olds by State, 2005 Note: Incarcerated population not separated out. All of the above categories include incarcerated individuals. Sources: US Census Bureau, 2005 American Community Survey: Public Use Microdata Samples
600 515 494 500 428 There were 1,525,924 prisoners in 2005 400 311 300 211 200 146 100 0 1980 1985 1990 1995 2000 2005 Incarceration Rate in the U.S. – Prisoners Under Federal and State Jurisdiction Per 100,000 Residents, 1980 to 2005 Source: US Bureau of Justice Statistics, US Census Bureau
1,000 823 798 800 739 725 702 700 612 600 564 554 544 537 531 515 505 490 488 486 482 477 472 471 467 460 446 442 419 410 406 402 400 390 375 400 368 352 341 341 340 334 330 326 314 295 292 276 258 253 218 193 181 200 167 153 0 Utah Ohio Iowa Idaho Texas Maine Alaska Illinois Florida Hawaii Kansas Indiana Oregon Nevada Arizona Georgia Virginia Vermont Missouri Montana Alabama Arkansas Colorado Nebraska Delaware Michigan Kentucky Maryland Louisiana Wyoming California Oklahoma Tennessee New York Wisconsin Minnesota Mississippi New Jersey Connecticut Washington New Mexico Pennsylvania Rhode Island United States South Dakota North Dakota West Virginia Massachusetts North Carolina South Carolina New Hampshire Incarceration Rate by State in 2005 – Prisoners Under Federal and State Jurisdiction Per 100,000 Residents Source: US Bureau of Justice Statistics, US Census Bureau
Total Population Prison Population 50% 43.1% 40% 34.0% 31.6% 29.3% 30% 22.6% 20% 12.3% 10.1% 9.6% 10% 4.5% 2.9% 0% Less than 9th Grade 9th to 12th Grade, High School Some College College Graduate or No Diploma Graduate (Includes No Degree More Equivalency) Educational Attainment of 18 to 64 Year Olds – Total U.S. Population vs. the Prison Population Source: US Bureau of Justice Statistics 2002 data, US Census Bureau 2005 data
Performance • ABE Participation (data available only for state administered adult education programs) • GED Production • College Participation of Non-Traditional Adults
Enrollment in State-Administered Adult Education Programs per 1,000 Residents with Less than a High School Diploma by Age-Group, 2005 (United States) 350 278 280 210 140 107 70 22 0 16 to 24* 25 to 44 45 and Older * 16 to 24 year olds with no high school diploma or equivalent, not enrolled Source: US Department of Education
788 800 606 600 533 481 446 429 405 381 380 400 365 361 341 339 322 321 320 308 298 296 278 272 251 245 236 231 229 226 220 219 212 208 207 206 195 195 192 192 190 186 185 181 200 176 153 152 150 139 118 116 109 95 92 63 0 Utah Iowa Ohio Idaho Texas Maine Alaska Illinois Florida Hawaii Kansas Indiana Oregon Nevada Georgia Arizona Virginia Vermont Missouri Montana Alabama Arkansas Colorado Nebraska Delaware Michigan Kentucky Maryland Louisiana Wyoming California Dis of Col Tennessee Oklahoma New York Minnesota Wisconsin Mississippi New Jersey Connecticut Washington New Mexico Rhode Island Pennsylvania United States North Dakota South Dakota West Virginia Massachusetts North Carolina South Carolina New Hampshire Enrollment of 16 to 24 Year Olds in State-Administered Adult Education Programs per 1,000 16 to 24 Year Olds with Less than a High School Diploma, 2005 * 16 to 24 year olds with no high school diploma or equivalent, not enrolled Source: US Department of Education
Enrollment of 25 to 44 Year Olds in State-Administered Adult Education Programs per 1,000 25 to 44 Year Olds with Less than a High School Diploma, 2005 280 250 213 210 187 168 158 153 146 141 139 138 140 129 128 127 123 115 107 107 103 98 96 95 94 94 93 89 89 87 86 85 85 84 82 80 80 79 77 76 75 74 73 71 70 68 66 70 55 54 52 52 48 48 42 38 0 Utah Iowa Ohio Idaho Texas Maine Alaska Illinois Florida Hawaii Kansas Oregon Indiana Nevada Georgia Arizona Virginia Vermont Missouri Montana Alabama Colorado Arkansas Nebraska Delaware Michigan Kentucky Maryland Louisiana Wyoming California Dis of Col Oklahoma Tennessee New York Minnesota Wisconsin Mississippi New Jersey Connecticut Washington New Mexico Rhode Island Pennsylvania United States South Dakota North Dakota West Virginia Massachusetts South Carolina North Carolina New Hampshire Source: US Department of Education
100 84.5 80 60 40 20 14.9 4.7 0.5 0 16 to 24* 25 to 34 35 to 49 50 and Older GEDs Awarded Per 1,000 Adults with Less than a High School Diploma or Equivalent by Age-Group, 2005 (United States) * 16 to 24 year olds with no high school diploma or equivalent, not enrolled Source: GED Testing Service, US Census Bureau 2005 ACS data
240 North Dakota = 340 202 185 183 180 156 153 141 141 138 130 129 128 125 123 121 120 117 117 114 120 110 110 109 109 106 106 106 106 105 100 96 95 94 92 92 88 85 84 84 82 79 78 76 75 74 71 70 70 68 63 62 60 33 31 0 Utah Iowa Ohio Idaho Texas Maine Alaska Illinois Hawaii Florida Kansas Oregon Indiana Nevada Georgia Arizona Virginia Vermont Montana Missouri Alabama Arkansas Colorado Nebraska Michigan Delaware Kentucky Maryland Louisiana Wyoming California Tennessee Dis of Col Oklahoma New York Minnesota Wisconsin Mississippi New Jersey Washington Connecticut New Mexico Rhode island Pennsylvania United States North Dakota South Dakota West Virginia Massachusetts North Carolina South Carolina New Hampshire GEDs Awarded to Adults Ages 16 to 24 per 1,000 Adults Ages 16 to 24* with Less than a High School Diploma or Equivalent, 2005 * 16 to 24 year olds with no high school diploma or equivalent, not enrolled Source: GED Testing Service, US Census Bureau 2005 ACS data
45 39 35 35 32 31 30 30 29 27 26 25 25 25 25 23 23 23 21 21 20 20 20 19 18 18 18 18 18 18 18 18 17 17 17 17 17 16 15 15 15 14 14 14 15 13 13 13 13 12 11 10 9 9 6 0 Utah Iowa Ohio Idaho Texas Maine Alaska Illinois Hawaii Florida Kansas Indiana Oregon Nevada Georgia Arizona Virginia Vermont Montana Missouri Alabama Arkansas Colorado Nebraska Michigan Delaware Kentucky Maryland Louisiana Wyoming California Tennessee Oklahoma Dis of Col New York Wisconsin Minnesota Mississippi New Jersey Washington Connecticut New Mexico Rhode island Pennsylvania United States North Dakota South Dakota West Virginia Massachusetts North Carolina South Carolina New Hampshire GEDs Awarded to Adults Ages 25 to 34 per 1,000 Adults Ages 25 to 34 with Less than a High School Diploma or Equivalent, 2005 Source: GED Testing Service, US Census Bureau 2005 ACS data
40% 33.7 32.4 30 27.2 21.9 20 10 0 1990 1995 2000 2005 Percent of All GEDs Awarded to High School Aged Students (16 to 18 Years Old), from 1990 to 2005 Source: GED Testing Service
30% 25.6 25.1 1990 2005 25 20 16.1 14.1 15 13.9 13.7 12.7 11.9 10.9 9.5 10 6.8 6.7 6.2 6.0 4.9 4.4 5 3.9 2.3 1.5 1.0 0.8 0.3 0 16 17 18 19 20-24 25-29 30-34 35-39 40-49 50-59 60 + Age Distribution (%) of GEDs Awarded by Age-Group, 1990 and 2005 Source: GED Testing Service
40 33.7 30 25.9 25.7 25.6 22.3 21.8 20.7 20.4 20.1 20.1 19.6 19.3 18.0 20 15.8 15.6 14.8 14.6 13.7 13.6 13.5 13.4 12.4 12.4 12.3 11.8 11.8 11.6 10.6 10.3 10.2 9.8 9.5 9.3 9.2 9.1 8.9 10 7.0 6.6 Pennsylvania 5.2 4.1 Wyoming Arizona 1.9 -0.1 0 -0.5 Utah Iowa Ohio Texas Maine Alaska Florida Kansas Indiana Oregon Georgia Virginia -3.0 Montana Vermont Missouri Alabama Colorado Arkansas Nebraska Michigan Delaware Kentucky Maryland Tennessee Oklahoma New York Wisconsin Minnesota Mississippi New Jersey Washington Connecticut New Mexico Rhode Island United States North Dakota South Dakota Massachusetts North Carolina South Carolina New Hampshire -10 District of Columbia -20 -21.9 -30 Change in the Percentage of All GEDs Awarded to High School Aged Students (Ages 16 to 18) by State from 1990 and 2005 Source: GED Testing Service Note: 1990 data not available for CA, HI, ID, IL, LA, NV, WV
45% 40.1% 30% 24.1% 23.2% 22.0% 19.8% 18.6% 17.7% 17.0% 16.9% 16.7% 16.1% 15.1% 15.0% 14.7% 14.8% 14.7% 14.5% 14.5% 14.4% 14.3% 14.0% 14.0% 13.9% 13.7% 13.2% 13.1% 13.0% 12.9% 12.8% 15% 12.2% 12.0% 12.0% 11.4% 11.1% 11.1% 10.9% 10.9% 10.7% 10.7% 10.6% 10.5% 10.5% 9.7% 9.6% 9.6% 9.1% 9.0% 8.6% 8.5% 7.6% 7.5% 0% Utah Iowa Ohio Idaho Texas Maine Alaska Illinois Florida Hawaii Kansas Oregon Indiana Nevada Arizona Georgia Virginia Vermont Missouri Montana Alabama Colorado Arkansas Nebraska Michigan Delaware Maryland Kentucky Louisiana Wyoming California Oklahoma Tennessee New York Minnesota Wisconsin Mississippi New Jersey Washington Connecticut New Mexico Rhode Island Pennsylvania United States North Dakota South Dakota West Virginia Massachusetts North Carolina South Carolina New Hampshire Enrollment of 25 to 49 Year Olds as a Percentage of 25 to 49 Year Olds with a High School Diploma But No College (2005) Sources: NCES, IPEDS Enrollment Survey; US Census Bureau 2005 ACS data
The Importance of the “Re-Entry” Pipeline and the Ability of the U.S. to Remain Globally Competitive
80% 60% 55.0% 45.9% 41.9% 37.4% 40% 20% 0% Current Percentage of Projected Percentage Projected Percentage Percentage Needed to Adults 25 to 64 with in 2025 with Current in 2025 with Current Reach Best-Performing College Degrees Annual Degree Annual Degree Countries by 2025 (2005) Production Production and Net Migration Current Educational Attainment, Educational Attainment in 2025 with Current Degree Production, and the Best Performing Countries in 2025 (United States)
How Can the U.S. Reach International Competitiveness? Current Degree Production Combined with Population Growth and Migration, and Best Performance* on the Student Transition and Completion Measures Degrees Produced from 2005 to 2025 with Current 40,605,747 Rate of Production Additional Degrees from Population Growth 1,255,167 Additional Degrees from Net Migration of College- 7,045,932 Educated Residents Reaching Best Performance In High School 1,265,118 Graduation Rates by 2025 Performance Measures Are Cumulative and Are Based on Traditional College-Age Students Reaching Best Performance In College-Going Rates 3,270,900 by 2025 Reaching Best Performance In Rates of Degree 7,347,209 Production Per FTE Student Total Degrees Produced from 2005 to 2025 If All of 60,790,073 the Above Degrees Needed to Meet Best Performance (55%) 63,127,642 0 20 40 60 80 Millions * Best performance is the average of the top three states.
Even Best Performance with Traditional College-Aged Students at Each Stage of the Educational Pipeline Will Leave Gaps in More than 30 States Texas 1,333,645 Florida 893,504 California 560,688 New Jersey 320,720 Tennessee 307,956 Nevada 287,565 Louisiana 204,814 Arkansas 186,640 Kentucky 159,765 North Carolina 132,748 Arizona 122,061 Mississippi 115,120 In order to reach international competitiveness by 2025, the U.S. and 32 states can’t close the gap with even best performance with traditional college students. They must rely on the re-entry pipeline – getting older adults back into the education system and on track to attaining college degrees. Ohio 114,375 South Carolina 112,681 Alabama 110,495 West Virginia 74,752 Alaska 65,853 Oklahoma 62,332 Oregon 53,995 Michigan 53,574 New Mexico 47,420 Wisconsin 44,757 Maine 39,436 Idaho 37,706 Montana 34,547 Hawaii 28,659 Georgia 25,326 Wyoming 24,741 Maryland 23,542 Connecticut 10,875 Missouri 8,898 Indiana 2,788 0 300,000 600,000 900,000 1,200,000 1,500,000
No school completed $15,531 1st-4th grade $14,894 5th-8th grade $15,840 9th grade $17,189 10th grade $18,031 $19,095 11th grade 12th grade, no diploma $22,319 High school graduate, or GED $27,367 Some college, no degree $34,644 Associate degree $37,716 Bachelors degree $54,532 Masters degree $66,919 $107,353 Professional degree Doctorate degree $91,797 $0 $30,000 $60,000 $90,000 $120,000 Average Personal Income of 25 to 64 Year Olds by Level of Education Completed, 2005 Source: US Census Bureau, 2005 American Community Survey
Average Personal Income of 25 to 64 Year Olds by Level of Education Completed, 2005 No school completed If these residents were to complete high school or equivalent, and the additional earnings associated it, the U.S. would experience a $191 billion increase in personal income 1st-4th grade 5th-8th grade 9th grade 10th grade 11th grade 12th grade, no diploma High school graduate, or GED $27,367 Some college, no degree $34,644 Associate degree $37,716 Bachelors degree $54,532 Masters degree $66,919 $107,353 Professional degree Doctorate degree $91,797 $0 $30,000 $60,000 $90,000 $120,000 Source: US Census Bureau, 2005 American Community Survey
Average Personal Income of 25 to 64 Year Olds by Level of Education Completed, 2005 No school completed If these residents were to complete an associates degree, and the additional earnings associated it, the U.S. would experience a $848 billion increase in personal income 1st-4th grade 5th-8th grade 9th grade 10th grade 11th grade 12th grade, no diploma High school graduate, or GED Some college, no degree $34,644 Associate degree $37,716 Bachelors degree $54,532 Masters degree $66,919 $107,353 Professional degree Doctorate degree $91,797 $0 $30,000 $60,000 $90,000 $120,000 Source: US Census Bureau, 2005 American Community Survey
The Relationship Between Personal Income and Tax Revenues $45,000 CT 40,000 Correlation = 0.84 MA NJ MD NY 35,000 CO NH MN VA DE IL Personal Income Per Capita, 2003 CA AK WA RI WY PA NV US MI NE HI VT FL WI 30,000 OH KS MO OR TX SD IN ND GA ME IA TN NC AZ OK MT AL SC LA KY UT 25,000 ID NM WV AR MS 20,000 Actual Tax Revenues Per Capita, 2003 $2,000 3,000 4,000 5,000
95 ND MN WY MT AK ME VT SD IA NH Correlation = 0.76 HI WI NE CT UT KS PA MA WA 90 MI CO MD OH NJ OR VA MO IL DE ID IN RI FL NY OK US WV NC GA SC 85 TN AZ AR NM LA AL NV KY MS CA TX 80 -25 0 25 State Health Index, United Health Foundation The Relationship Between Education and Health Percent of Adults with a High School Diploma or Higher
Summary • For the first time in history, the U.S. is losing ground to other countries in educational attainment of its workforce • Increasing demand for higher levels of education within our own workforce – particularly in occupations that pay a living wage • Shifting demographics – within our workforce, race/ethnic populations that are growing at the highest rates are the least-educated, the most likely to drop out of high school, and the least successful in college. • Large Target Populations that Are Underserved • We are leaving a large segment of this population behind • Improvements in adult education and literacy are vital for the U.S. to remain competitive • There are tangible benefits to increasing the levels of education of those who fell out of the education system.