Download

1 / 35
370 likes | 420 Views
Learn how soil water budget modeling can help estimate soil water content using precipitation, evaporation, and runoff data. Explore hydrological principles and methods for accurate water budget equations.

E N D
Modeling Your Soil-Water Budget Jerry P. Henzel & Cyndy L. Henzel
Soil Moisture Data • 31,499 Measurements in 173 Schools
Principals of Hydrology Suggest: • Soil moisture & runoff depend on the amount and timing of precipitation • Precipitation is localized & specialized • Varies from month to month
Principals of Hydrology Suggest: • Varies from month to month • Varies from place to place • Leads to a Variable Amount of Water Available • Properties of soil affect amount stored Texture, porosity, conductivity, sequence & thickness of horizons
Sum of the Parts Sum of All Local Parts Global Hydrologic Cycle
The Water Budget? • The Water Budget is an accounting of all water on a local scale i.e. local hydrologic cycle
Hypothesis • Can the Soil Water Budget model can be used as an indicator to show soil water content in the soil where such data is not available?
The Water Budget Equation Accounting of Input, Output & Storage P = AE + S + ST P = Incoming Precipitation AE = Actual Evaporation S = Surplus or Leftover water ST Soil Moisture Recharge
What We Need To Know? • To find soil water content we need to know how much was evaporated and how much ran-off. • The leftover is what is left in the soil
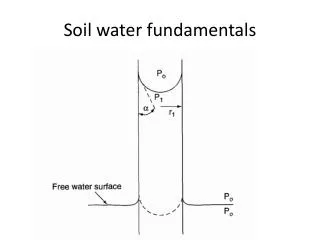
How Much is Lost to Evaporation? • Calculate it • Evaporation depends on the amount of heat (i.e. temperature) • Use temperature and latitude (duration of daylight) to find the maximum possible evaporation (Potential Evapotranspiration)
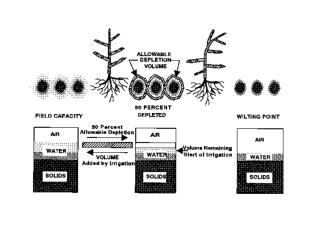
How Much Ran-off? • We use field capacity? • How much can a soil hold? • Once it reaches it maximum the rest is run-off
Field Capacity Examples • Sand 12* • Loamy Sand 14 • Sandy Loam 23 • Loam 26 • Silt Loam 30 • Silt 32 • Silty Clay Loam 34 • Silty Clay 36 • Clay 36 *Cm/Meter of Soil Source: ASCE, 1990, Table 2.6 p.21
What We Know • The Amount of precipitation • Calculate the potential evapotranspiration • Calculate the run-off • Horizon depth/field capacity • With the above and a formula we can calculate the soil water content
Defining Time & Space • For 1996-1998 • 3 Years of soil moisture data • 3 Years of temperature data • 3 Years of precipitation data • Spatially • Different water budget regimes • Dry < 50 cm/year • Wet > 90 cm/year
Methodology • Use Modeling Your Water Balance • Gather Soil Moisture Content Data • Compare the Above • Visually • Statistical Test of Correlation • Statistical Test of Significance
The Coefficient of Correlation • Index of Relationship • Low values indicate a low degree of relationship • High values indicate a high degree of relationship • Scale runs from –1 - 0 - +1 • Does not indicate causality
Assumptions for Pearson’s r • Distributions are unimodal • Distributions are asymmetrical • Violations do not affect r very much Havlicek & Peterson, Psychological Bulletin 84 • Very Robust
Assumptions for Spearman’s r • Distribution Free • Well – tried alternative • Approximates the Pearson Product Moment • Quick & Easy to calculate
Is This Significant? • What is the probability the result is a result of a chance association? • Significant Values for 24 Degrees of Freedom • .05 - .343 • .001 - .485 • At 99.9% confidence level we can state that result is not a result of a chance association
Conclusion • The soil water budget model can be used as an indicator to show soil water content in the soil where such data is not available
Further Research • Expand your spatial sampling • Experiment with Field Capacity values • Investigate the correlations when runoff is high • Further test correlations with ‘extreme’ samples
Further Research • Permanent Wilting Point (PWP) • Plants cannot get to the water • Evaporation will not take place • Large in clayey soils • Depth of soil for field capacity • (Field capacity - PWP * Thickness of Horizon)
What Your Student Learn • Earth Systems • Math • Statistics • Spreadsheet Skills • Modeling • Graphing • Critical Thinking Skills
Applications of the Water Budget • Estimate Soil Moisture Content • Calculate irrigation needs • Which Sands/Clays can support traffic • Calculate Evapotranspiration • Essential in estimating potential vegetation types • Essential for estimating crop yields • Evaluate Local Environments • Water resource potential • Climatic classification