Download
1 / 7
70 likes | 204 Views
This report summarizes the Ichthyophonus Sub-Committee's findings from studies on Chinook salmon in the Yukon River, highlighting the need for baseline monitoring and future research. It outlines the prevalence of infection in infected and diseased fish, noting that infection is likely from food sources and that infected fish typically do not recover. The report emphasizes the importance of continued sampling in monitoring Ichthyophonus trends and identifies potential research areas, including salmon spawning success and pathogen effects on population density.

E N D
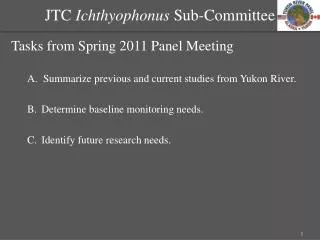
JTC Ichthyophonus Sub-Committee Tasks from Spring 2011 Panel Meeting • Summarize previous and current studies from Yukon River. • Determine baseline monitoring needs. • Identify future research needs.
JTC Ichthyophonus Sub-Committee • Summarize previous and current studies from Yukon River. • “Infected” and “diseased” • Infection presumed to be from food source and infected fish don’t recover. • Subclinical microbiological assays are not 100% accurate. • Includes In vitro culture, Histology, PCR • Females generally have higher infection prevalence. • Prevalence in both sexes is greater late in the Chinook salmon run than early. Clinical Example Sub-Clinical Example: Histological Photographs by S. Zuary
JTC Ichthyophonus Sub-Committee B) Determine need for continued sampling • Baseline Monitoring Alternatives: • Reestablish monitoring at Emmonak via LYTF. • Support continued sampling in middle Yukon via Rapids fish wheel. Figure 1. Time-series of Ichthyophonus prevalence at Emmonak (river mile 24) based on PCR, in-vitro, and clinical signs (visual identification of the disease) in Chinook salmon (n = sample size). LOESS non-parametric smoothing (dashed line) was applied to visualize temporal trends of parasite prevalence (Graph based on compiled published and unpublished data by L. Dehn, 2010). Figure 2. Change in clinical ichthyophoniasis in Chinook salmon sampled at rkm 1,170 over a 12-year period (1999-2010) showing a steady decline from its peak in 2003 to a low in 2010, paralleling a 57% decline in population density over the same period. Zuray et al. In press.
JTC Ichthyophonus Sub-Committee Figure 1. Change in clinical ichthyophoniasis in Chinook salmon sampled at rkm 1,170 over a 12-year period (1999-2010) showing a steady decline from its peak in 2003 to a low in 2010, paralleling a 57% decline in population density over the same period. Zurayet al. In press.
JTC Ichthyophonus Sub-Committee • Identify future research needs. • Chinook salmon spawning success. • Egg, and juvenile salmon survival rate. • Premature mortality of diseased Chinook salmon. • Fish wheel bias. • Prevalence in Canadian tributaries. • Ichthyophonus research in the marine environment.