Ocean Biodiversity Databases: Global Projects and Insights
170 likes | 232 Views
This article delves into ocean biodiversity databases and management systems with findings from international projects. It covers a wide range of data, including plankton measurements, biogeochemical provinces, and species diversity indices. The text discusses the impact of climate variability on marine ecosystems, particularly zooplankton communities influenced by the North Atlantic Oscillation. It also outlines the collaborative efforts of specialists from various institutions worldwide and funding details for the project. The aim is to shed light on the ecosystem impacts of global change through long-term observations of the epipelagic community in the Indian Ocean.

Ocean Biodiversity Databases: Global Projects and Insights
E N D
Presentation Transcript
Biodiversity databases and database management systems for the world’s ocean: experience and outputs from five international projectsSergey PiontkovskiMarine Sciences Research Center, Stony Brook University, USA;Institute of Biology of the Southern Seas, Sevastopol, Ukraine spiontkovski@notes.cc.sunysb.eduand Robert WilliamsPlymouth Marine Laboratory, UKbw@mail.pml.ac.uk
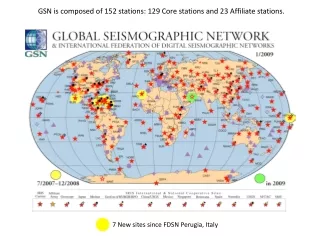
Global station network • 163 cruises from 1957 to 1995 • 21975 oceanographical stations
Chlorophyll a and mesozooplankton measurements Plankton Data( World Ocean Database 1998) Plankton Data of the Former Soviet Union: 1968-1992Background: CZCS composite chlorophyll
“Akademician Vernadsky” “Akademician Kovalevsky” “Professor Vodyanitsky”
Biogeochemical provinces of the ocean (by Longhurst, 1998; Pauly et al., 2000) Eastern Tropical Atlantic Province South Atlantic Gyral Province
Plankton fields: direct and remote measurements Chlorophyll a: Onboard CZCS Bioluminescence Intensity (0-100m) Zooplankton Biomass (0-100m, mg/m3)
Distribution of onboard chlorophyll a measurements in the database Distribution of zooplankton data in the database
Relationship between phyto- and zooplankton biomass over regions NASA website Piontkovski et al., 2002
Normalised biomass spectra for 7 autumn AMT cruises. Latitude (S) Piontkovski et al, 2002
Species diversity index H’ • (Shannon, 1948) • fi is the relative frequency of species i, and • s is the numbers of these species H’ characterises the diversity in the information units i.e. bits of information
Summary of the Atlantic Ocean data set: 93 cruises, 9474 CTD stations (1951-1991)
Surface chlorophyll-a distribution (µg l-1)on the background of 600 CTD stations carried out by two vessels in October, 1986.Spatial resolution between stations is about 30 miles Jun-Jul 1987 Africa Brazil
Dominant Wavelength Temperature Secchi Disk Salinity Chlorophyll-a Forele-Ule Scale AV’41 Data (Feb-Mar’90)
Temperature Measured: Feb-Mar’90 Feb’90 AVHRR Data from Mar’90 AVHRR Ocean Pathfinder Mean SST
MARINE ECOSYSTEMS AND CLIMATE VARIABILITY:ZOOPLANKTON COMMUNITY RESPONSE ALONG THE ARRAYS OF THE NORTH ATLANTIC OSCILLATION INFLUENCE • Teams: 30 specialists from14 institutions in 10 countries: • 1. Stony Brook University, USA • 2. Scripps Institution of Oceanography, USA • 3. Texas A&M University, USA • 4. Plymouth Marine Laboratory, U.K. • 5. Institute of Marine Sciences, Germany • 6. Baltic Sea Research Institute, Germany • 7. Fisheries Research Institute, Latvia • 8. Laboratory of Biological Oceanography, France • 9. Trieste University, Italy • 10. Institute of Marine Sciences, Turkey • 11. Institute of Oceanology, Bulgaria • 12. Institute of Biology of the Southern Seas, Ukraine • 13. Caspian Biological Station, Azerbaijan • 14. Sir Alistair Hardy Foundation, U.K. Project Coordinator: Sergey Piontkovski Marine Sciences Research Center, Stony Brook University, USA F Funding requested: $1,248,394 D Duration of effort: 3 years (December 1, 2002- November 30, 2005)
Expression of Interest: Network of Excellence (FP6-2002) PLAnkton Time series Observations (PLATO): ecosystem impacts of global change
Multiscale diagrams for the epipelagic community of the Indian Ocean