Download
1 / 35
350 likes | 529 Views
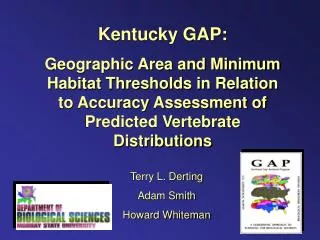
Kentucky GAP: Geographic Area and Minimum Habitat Thresholds in Relation to Accuracy Assessment of Predicted Vertebrate Distributions. Terry L. Derting Adam Smith Howard Whiteman. Kentucky GAP:

E N D
Kentucky GAP: Geographic Area and Minimum Habitat Thresholds in Relation to Accuracy Assessment of Predicted Vertebrate Distributions Terry L. Derting Adam Smith Howard Whiteman
Kentucky GAP: Geographic Area and Minimum Habitat Thresholds in Relation to Accuracy Assessment of Predicted Vertebrate Distributions Terry L. Derting Adam Smith Howard Whiteman
Kentucky GAP: Geographic Area and Minimum Habitat Thresholds in Relation to Accuracy Assessment of Predicted Vertebrate Distributions Terry L. Derting Adam Smith Howard Whiteman
BroadheadSkink TigerSalamander Bobcat Kentucky Warbler Species Modeled Reptiles - 51 Amphibians - 52 Mammals - 63 Breeding Birds - 152 Wintering Birds - 111
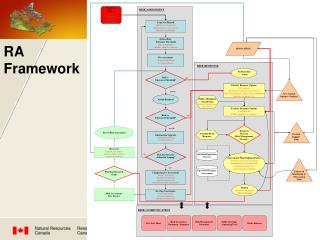
30m2 Input Layers for Models KY-GAP Land Cover Data Digital Elevation Model NWI Data
Species Distribution Maps Marginal Potentially suitable Potentially suitable-Aquatic No Data Gray fox Tiger salamander
Marginal Potentially suitable Potentially suitable-Aquatic No Data Modeling of Edge Habitat
Accuracy Analysis Methods of Evaluation: • Validation AreaAssessment(803 – 262,415 ha)
Omission error: species not predicted to occur in area where it had been recorded Commission error: species predicted to occur in area where it had not been recorded Match: species occurrence was predicted as recorded
Methods of Evaluation: • Validation Area Assessment(803 – 262,415 ha) • Physiographic Province Assessment (204,400 – 2,674,000 ha) Mississippi Alluvial Basin Mississippi Embayment Shawnee Hills Mississippian Plateaus Knobs Bluegrass Appalachian Plateaus Cumberland Mountains Species List
Methods of Evaluation: • Validation Area Assessment • Physiographic Province Assessment • Statewide Assessment
Predicted distributions compared with species records from database
Results Assessment of Validation Areas 80%
Results Assessment of Physiographic Provinces 80%
Results Statewide Accuracy Assessment 80%
Amphibians Reptiles Mammals Breeding Birds Wintering Birds Results Statewide Accuracy Assessment ( 5 records/species) 100 80% Percent 50 0 Omission Match
Error rates: Aquatic vs. Terrestrial ( 10 records/species) n=16 n=3 n=23 n=8 P=0.014* P<0.0001** *t-test, **Mann-Whitney U test
Lessons Learned Using Three Levels of Geographic Area for Accuracy Assessment • Use of species lists from very large geographic areas (e.g., provinces) was associated with an exaggerated degree of accuracy. • Comparison of accuracy values using multiple validation areas and statewide locational records facilitates identification of model strengths and weaknesses.
Minimum Habitat Threshold Comparisons Mammoth Cave National Park
Minimum Habitat Threshold Comparisons 1% Threshold habitat 1% total area 1% Vulpes vulpes
10% Minimum Habitat Threshold Comparisons 10% Threshold habitat 10% Vulpes vulpes
25% Minimum Habitat Threshold Comparisons 25% Threshold Vulpes vulpes
To what extent do agreement rates decrease as the minimum habitat threshold is increased?
Minimum Habitat Threshold Minimum Habitat Thresholds for All Groups
a a a* b b b c c Reptiles Amphibians a b a b b b c d Mammals Breeding Birds *ANOVA, P < 0.05
1% Minimum Habitat Threshold Comparisons Pipistrellus subflavus
10% Minimum Habitat Threshold Comparisons Pipistrellus subflavus
25% Minimum Habitat Threshold Comparisons Pipistrellus subflavus
Recommendation Use of minimum habitat thresholds enhanced biological validity of accuracy assessments
Acknowledgements National GAP (USGS) Kentucky Department of Fish and Wildlife Resources
Acknowledgements Tom Kind Mark Drew Geoff Ghitter Mike Busby Keith Wethington David Vichitbandha Dave Frederick Matt Cole Kelly Somerlot
Acknowledgements • KY Department of Fish and Wildlife Resources Jeff Sole Laura Burford Rocky Pritchert Steve Thomas Sunni Lawless Tim Slone Traci Wethington Jason Paxico Roy Grimes • KY State Nature Preserves Commission Brainard Palmer-Ball Morehead University Les Meade Eastern KY UniversityChuck Elliott Gary Ritchison Paul Cupp Murray State University Duke Wilder Ed Zimmerer Tom Timmons University of Cincinnati Guy Cameron Austin Peay State Univ. Floyd Scott
Acknowledgements • Daniel Boone National Forest John MacGregor Lynda Perry East KY Power Co. Jeff Hohman University of Kentucky Mike Lacki David Maehr Thomas Barnes EcoTech Hal Bryan