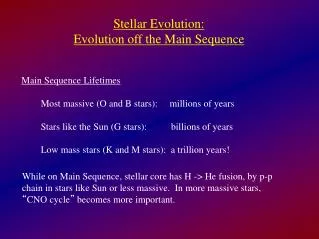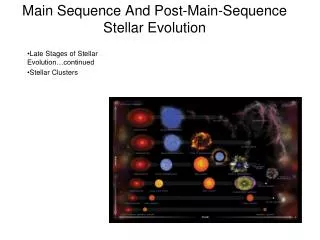
Stellar Evolution up to the Main Sequence
Stellar Evolution up to the Main Sequence. Stellar Evolution. Recall that at the start we made a point that all we can "see" of the stars is: Brightness Color (Spectra) Position Distance (if we are lucky or clever) Let's see if there are any correlations. Stellar Evolution.

Stellar Evolution up to the Main Sequence
E N D
Presentation Transcript
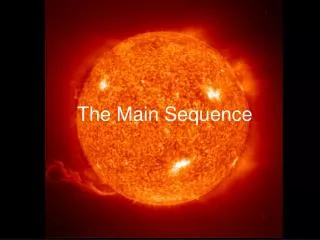
Stellar Evolution Recall that at the start we made a point that all we can "see" of the stars is: • Brightness • Color (Spectra) • Position • Distance (if we are lucky or clever) Let's see if there are any correlations
Stellar Evolution Using distance (when we know it) we can convert the Brightness (apparent magnitude) into the absolute magnitude, or even the Luminosity To make things easy we can write the luminosity relative to that of the Sun, L/L
Stellar Evolution The Color, or spectra, we can convert to • A Spectral Class • A Temperature • A B-V value • V is the visible magnitude • B is the magnitude as seen on photographic plates • Photographic plates are more sensitive to blue light – blue stars will appear brighter • B-V gives a numerical "Color" index • For comparison • the yellowish Sun (G2) has a B-V index of 0.656 and a surface temperature of about 6000K • the bluish Rigel (B8) has B-V index of -0.03 and a surface temperature of about 11000K
1000 100 10 1 .1 .01 Stellar Evolution We can plot the Luminosity ratio versus the color: The Sun would go here O B A F G K M
Stellar Evolution This plot was independently discovered by Hertzsprung and Russell It is now called the Hertzsprung-Russell, or H-R, Diagram Henry Norris Russell (1877-1957) Ejnar Hertzsprung (1873-1967)
1000 100 10 1 .1 .01 The HR Diagram The 50 Nearest Stars The Sun O B A F G K M
1000 100 10 1 .1 .01 The HR Diagram The 50 Brightest Stars O B A F G K M
1000 100 10 1 .1 .01 O B A F G K M The HR Diagram
1000 100 10 1 .1 .01 O B A F G K M The HR Diagram There appears to be three main areas where the stars are grouped
1000 100 10 1 .1 .01 O B A F G K M The HR Diagram This curve is where 90% of the stars appear
1000 100 10 1 .1 .01 O B A F G K M The HR Diagram These are pretty dim, but also very hot…white hot This implies that they are very small
1000 100 10 1 .1 .01 O B A F G K M The HR Diagram These are cool, but very bright - the size must be huge
1000 100 10 1 .1 .01 O B A F G K M HR Diagram Red Giants Blue Giants Main Sequence White Dwarfs Red Dwarfs
Giant Molecular Clouds Distant dark nebulae are hard to observe, because they do not emit visible light However, dark nebulae can be detected using microwave observation, because the molecules in nebulae emit at millimeter wavelengths Giant molecular clouds are immense nebular so cold that their constituent atoms can form molecules. Giant molecular clouds are found in the spiral arms of our Galaxy.
Giant Molecular Clouds and Star-forming Regions Star-forming regions appear when a giant molecular cloud is compressed This can be caused by the cloud’s passage through one of the spiral arms of our Galaxy, by a supernova explosion, or by other mechanisms
Molecular Clouds Giant Molecular Cloud in Orion Infrared view Disorderly Complex From IRAS satellite
"Cores" and Outflows 1 pc Molecular or Dark Clouds Jets and Disks Extrasolar System Stages of Star Formation
# t to Next Stage (yr) Core Temp. (K) Surface Temp (K) Diameter (Km) Description 1 2,000,000 10 10 100,000,000,000,000 Interstellar Gas Cloud 2 30,000 100 10 1,000,000,000,000 Cloud Fragment 3 100,000 10,000 100 10,000,000,000 Cloud Fragment 4 1,000,000 1,000,000 3,000 100,000,000 ProtoStar 5 10,000,000 5,000,000 4,000 10,000,000 ProtoStar 6 30,000,000 10,000,000 4,500 2,000,000 Star 7 10,000,000,000 15,000,000 6,000 1,500,000 Main Sequence Stages of Starbirth
Lifetime on the Main Sequence • Luminosity basically describes how fast the star is ‘burning’ its fuel. • This is clearly related to how much fuel there is because the greater the mass the higher the pressures and temperatures: L M3 • Lifetime is “how much fuel / how fast it’s used” T = M/L 1/M2
Lifetime on the Main Sequence Here are some comparison values:
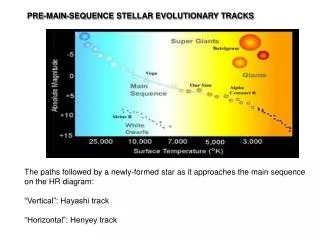
1000 100 10 1 .1 .01 The Path to the Main Sequence O B A F G K M
The T Tauri phase • Gravity causes the gas/dust cloud to condense. • The situation then usually becomes quite complex • Some of the infalling gas is heated so much by collisions that it is immediately expelled as an outgoing wind. • Jets and disks form as the infalling and outflowing gas collide and interact with changing magnetic fields. • Temperatures and masses are similar to the Sun, but they are brighter • They have fast rotation rates (few days) • Variable X-ray and radio emission • Not yet a 'star', but will be in a few million years
During the birth process, stars both gainand lose mass In the final stages of pre–main-sequence contraction, when thermonuclear reactions are about to begin in its core, a protostar may eject large amounts of gas into space Low-mass stars that vigorously eject gas are called T Tauri stars (age ~ 1 million year)
Jets: A circumstellar accretion disk provides material that a young star ejects as jets
Jets: Clumps of glowing gas are sometimes found along these jets and at their ends Known as Herbig-Haro Objects