Download
1 / 10
100 likes | 261 Views
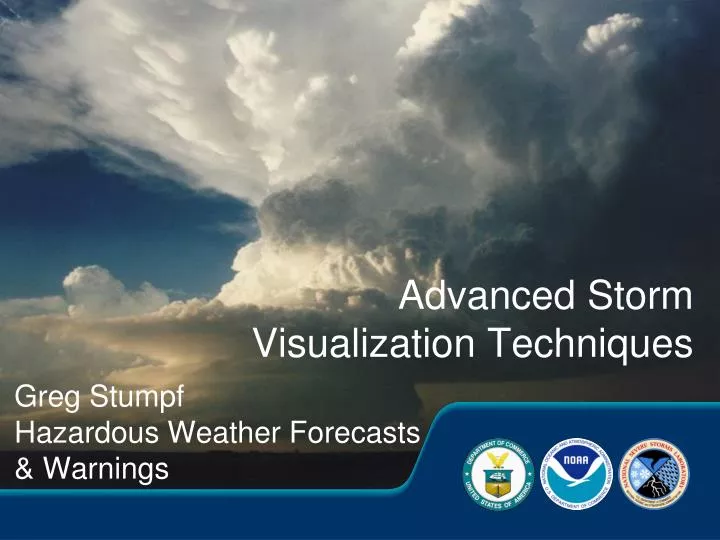
Advanced Storm Visualization Techniques. Greg Stumpf Hazardous Weather Forecasts & Warnings. Why advanced visualization for warning operations?. The atmosphere is four-dimensional. Improves the rapid cognition of storm structure and evolution. Opportunities for discovery.

E N D
Advanced StormVisualization Techniques Greg Stumpf Hazardous Weather Forecasts & Warnings
Why advanced visualization for warning operations? • The atmosphere is four-dimensional. • Improves the rapid cognition of storm structure and evolution. • Opportunities for discovery. NSSL Laboratory Review February 17-19, 2009
Hazardous Weather Testbed NWC Co-Location Collaboration and Partnership • Development • Integration • Testing • Training • Operations • Alliance with NWS: • Embedded NWS HQ Personnel • OS&T/MDL (Stumpf) • OS&T/NPI (Cate, Hall) • OCWWS (Ferree, Scharfenberg) • Warning Technology Workshops • Email Lists, BB Forums, Surveys NSSL Laboratory Review February 17-19, 2009
Warning Decision Support System (WDSS) • Storm Cell Identification and Tracking (SCIT) algorithm • Hail Detection Algorithm (HDA) • Mesocyclone Detection Algorithm (MDA) • Tornado Detection Algorithm (TDA) • Damaging Downburst Prediction and Detection Algorithm (DDPDA) • Developers gain understanding of operational requirements • NWS users exposed to latest R&D • Feedback Background NSSL Laboratory Review February 17-19, 2009
"Safety Net" Legacy Operational Displays are 2D Opportunities For Improvement algorithms Base Radar Data Analysis Paradigm of “stacking” 2D images not meeting needs of users Warning decision making demands rapid assessment of the 4D structure and evolution of storms NSSL Laboratory Review February 17-19, 2009
WDSS to WDSSII • Multi-Radar/Sensor Framework • Legacy algorithm development limited by inferior 2D visualization tools • WDSSII GUI (wg) developed NSSL Laboratory Review February 17-19, 2009
WDSSII GUI (wg) Virtual Globe By Comparison: Earth Viewer/Google Earth 1999 2004 NSSL Laboratory Review February 17-19, 2009
WDSSII GUI (wg) • How can we leverage/adapt 4D visualization techniques used in R&D to improve NWS operational warning decision making? • 2002-2003: Field testing at NWS forecast offices NSSL Laboratory Review February 17-19, 2009
Transition to NWS Operations (2008) NSSL Laboratory Review February 17-19, 2009
Multi-parameter iso-surfaces and integrated dynamic cross-sections in the WDSSII GUI Geo-Wall Future R&D Strategies and Challenges NSSL Laboratory Review February 17-19, 2009