Latent Space Domain Transfer between High Dimensional Overlapping Distributions
290 likes | 440 Views
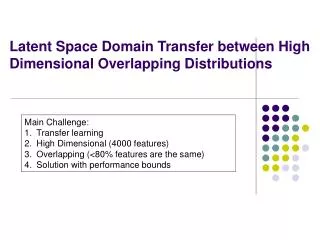
Sihong Xie† Wei Fan ‡ Jing Peng* Olivier Verscheure‡ Jiangtao Ren† †Sun Yat-Sen University ‡IBM T. J. Watson Research Center *Montclair State University. Latent Space Domain Transfer between High Dimensional Overlapping Distributions. Main Challenge: Transfer learning

Latent Space Domain Transfer between High Dimensional Overlapping Distributions
E N D
Presentation Transcript
Sihong Xie† Wei Fan‡ Jing Peng* Olivier Verscheure‡ Jiangtao Ren† †Sun Yat-Sen University ‡IBM T. J. Watson Research Center *Montclair State University Latent Space Domain Transfer between High Dimensional Overlapping Distributions Main Challenge: Transfer learning High Dimensional (4000 features) Overlapping (<80% features are the same) Solution with performance bounds
Standard Supervised Learning training (labeled) test (unlabeled) Classifier 85.5% New York Times New York Times
In Reality…… training (labeled) test (unlabeled) Classifier 64.1% Labeled data not available! Reuters New York Times New York Times
Domain Difference Performance Drop train test ideal setting Classifier NYT NYT 85.5% New York Times New York Times realistic setting Classifier NYT Reuters 64.1% Reuters New York Times
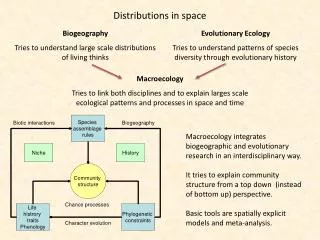
High Dimensional Data Transfer High Dimensional Data: Text Categorization Image Classification The number of features in our experiment is more than 4000 • Challenges: • High dimensionality. • more than training examples • Euclidean distance becomes similar • Feature sets completely overlapping? • No. Some less than 80% features are the same. • Marginally not so related? • Harder to find transferable structures • Proper similarity definition.
Transfer between high dimensional overlapping distributions • Overlapping Distribution Data from two domains may not be lying on exactly the same space, but at most an overlapping one.
Transfer between high dimensional overlapping distributions • Problems with overlapping distribution • Using only the overlapping features may be lack of predictive information Hard to predict correctly
Transfer between high dimensional overlapping distributions D2 { A, B} = 0.0181 > D2 {A, C} = 0.0101 • Overlapping Distribution • Use the union of all features and fill in the missing value “zeros”? Does it helps? A is mis-classified as the same class as C, instead of B
Transfer between high dimensional overlapping distributions • When one uses the union of the overlapping and non-overlapping features and leave the missing values as “zero”, • the distance of two marginal distributions p(x) can become asymptotically very large as a function of non-overlapping features: • becomes a dominant factor in similarity measure.
Transfer between high dimensional overlapping distributions • High dimensionality can underpin important features The “blues” are closer to the “green” than to the “red”
LatentMap: two step correction • Missing value regression • Brings marginal distribution closer • Latent space dimensionality reduction • Further brings marginal distribution closer • Ignores non-important noisy and “error imported features” • Identify transferable substructures across two domains.
Missing Value Regression D { img(A’), B} = 0.0109 < D {img(A’), C} = 0.0125 • Filling up missing values (recall the previous example) 2. Map from z to x Relationship found byregression model 1. Project to overlapped feature A is correctly classified as the same class as B
Dimensionality Reduction Word vector Matrix Missing Values Missing Values Filled Overlapping Features
Dimensionality Reduction • Project the word vector matrix to the most important and inherent sub-space Low dimensional representation
Solution (high dimensionality) The blues are closer to the reds than to the greens • recall the previous example The blues are closer to the greens than to the reds
Properties • It can bring the marginal distributions of two domain close. - Marginal distributions are brought close in high-dimensional space (section 3.2) - Two marginal distributions are further minimized in low dimensional space. (theorem 3.2) • It bring two domains conditional distributions close. - Nearby instances from two domains have similar conditional distribution (section 3.3) • It can reduce domain transfer risk - The risk of nearest neighbor classifier can be bounded in transfer learning settings. (theorem 3.3)
20 News groups comp rec Out-Domain First fill up the “GAP”, then use knn classifier to do classification comp.sys rec.sport comp.graphics rec.auto In-Domain Experiment (I) • Data Sets • 20 News Groups • 20000 newsgroup articles • SRAA (simulated real auto aviation) • 73128 articles from 4 discussion groups • Reuters • 21758 Reuters news articles • Baseline methods • naïve Bayes, logistic regression, SVM • Knn-Reg: missing value filled without SVD • pLatentMap: SVD but missing value as 0 Try to justify the two steps in our framework
Experiment (II) 10 win 1 loss Overall performance
8 win 3 loss 8 win 3 loss Compared with knnReg Compared with pLatentMap knnReg: Missing values filled but without SVD pLatentMap: SVD but without filling missing values Experiment (III)
Conclusion • Problem: High dimensional overlapping domain transfer -– text and image categorization • Step 1: Missing values filling up ---Bring two domains’ marginal distributions closer • Step 2: SVD dimension reduction --- Further bring two marginal distributions closer (Theorem 3.2) --- Cluster points from two domains, making conditional distribution transferable. (Theorem 3.3) • Code and data available from the author’s webpage
Solution (high dimensionality) • Illustration of SVD Top k singular vectors So We can …. Top k singular-values The most important and inherent information is in eigen-vectors corresponding to the top k eigen-values.
Analysis (I) Brings the marginal distributions close In original space • SVR (support vector regression) minimizes the distance between two domains’ marginal distributions Minimized by SVR Upper bound of distance between 2 domains’ points on overlapping features
Min Analysis (II) • SVD also clusters data such that nearby data have similar concept Objective function of k-means SVD achieve the optimum solution ∝
Analysis (III) • SVD (singular value decomposition) bounds the distance of two marginal distributions (Theorem 3.2) So the two marginal distributions are brought closer ||T||2 = Where >1 Vk =XT
R ∝ -cov(r1, r2) Where ri related with conditional distribution ↓ ↑ Analysis (IV) • Bound the risk (R) of Nearest Neighbor classifierunder transfer learning settings (Theorem 3.3) • The larger the distance between two conditional distributions, the higher the bound will be • Justify why we use SVD Cluster data such that nearest neighbors have similar conditional distribution
Experiment (IV) • Parameter sensitivity Number of neighbors to retrieve Number of the dimension of latent space