Download
1 / 48
480 likes | 505 Views
Chapter 9 – Day 3. Wednesday , April 17, 2019. 9.4 and 10.4: Measures of Variation and Box-and-Whisker Ch 9 and 10 Test Friday, 4/26 HW : TB416 #8-14 even (submit online) TB463 #6, 10 (submit online)

E N D
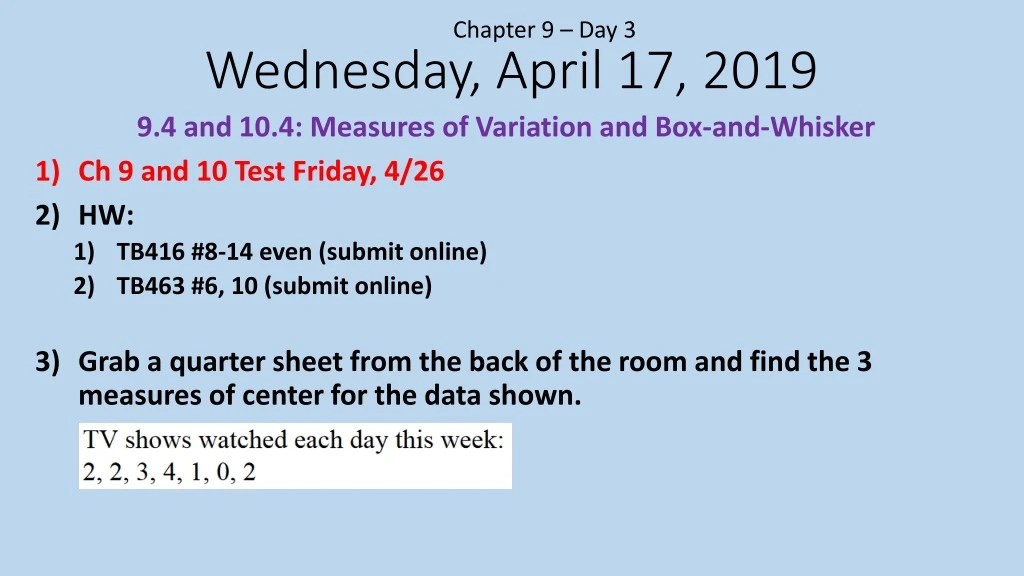
Chapter 9 – Day 3 Wednesday, April 17, 2019 9.4 and 10.4: Measures of Variation and Box-and-Whisker Ch 9 and 10 Test Friday, 4/26 HW: TB416 #8-14 even (submit online) TB463 #6, 10 (submit online) Grab a quarter sheet from the back of the room and find the 3 measures of center for the data shown.
1 Date Title Page 4/9 8.3 HW 53 4/9 Ch 8 Test 54 4/10 8.3 Notes: SA of Triangular Pyramids 55-56 4/10 8.3 HW 57 4/11 Clock Buddies 58 4/11 HW 59 4/15 9.1: Intro to Stats 60 4/15 9.1 HW 61 4/16 9.2 and 9.3 Notes62-63 4/16 9.2 and 9.3 HW64 4/17 9.4 and 10.4 Notes65-66 4/17 9.4 and 10.4 HW67 4/17 8.3 Quiz 68
65 9.4 and 10.4 Notes: Measures of Variation and Box-and-Whisker Plots 4/17
65 9.4 and 10.4 Notes: Measures of Variation and Box-and-Whisker Plots 4/17c Measure of Variation:
65 9.4 and 10.4 Notes: Measures of Variation and Box-and-Whisker Plots 4/17c Measure of Variation: how evenly data is spread out
65 9.4 and 10.4 Notes: Measures of Variation and Box-and-Whisker Plots 4/17c Measure of Variation: how evenly data is spread out We will calculate 2 MoVs:
65 9.4 and 10.4 Notes: Measures of Variation and Box-and-Whisker Plots 4/17c Measure of Variation: how evenly data is spread out We will calculate 2 MoVs: 1. Range
65 9.4 and 10.4 Notes: Measures of Variation and Box-and-Whisker Plots 4/17c Measure of Variation: how evenly data is spread out We will calculate 2 MoVs: 1. Range 2. Interquartile Range (IQR)
65 9.4 and 10.4 Notes: Measures of Variation and Box-and-Whisker Plots 4/17c Measure of Variation: how evenly data is spread out We will calculate 2 MoVs: 1. Range: maximum - minimum 2. Interquartile Range (IQR)
65 9.4 and 10.4 Notes: Measures of Variation and Box-and-Whisker Plots 4/17c Measure of Variation: how evenly data is spread out We will calculate 2 MoVs: 1. Range: maximum - minimum 2. Interquartile Range (IQR) 1. Data:
65 9.4 and 10.4 Notes: Measures of Variation and Box-and-Whisker Plots 4/17c Measure of Variation: how evenly data is spread out We will calculate 2 MoVs: 1. Range: maximum - minimum 2. Interquartile Range (IQR) 1. Data: a) Range:
65 9.4 and 10.4 Notes: Measures of Variation and Box-and-Whisker Plots 4/17c Measure of Variation: how evenly data is spread out We will calculate 2 MoVs: 1. Range: maximum - minimum 2. Interquartile Range (IQR) 1. Data: a) Range: 7-2
65 9.4 and 10.4 Notes: Measures of Variation and Box-and-Whisker Plots 4/17c Measure of Variation: how evenly data is spread out We will calculate 2 MoVs: 1. Range: maximum - minimum 2. Interquartile Range (IQR) 1. Data: a) Range: 7-2 = 5
65 9.4 and 10.4 Notes: Measures of Variation and Box-and-Whisker Plots 4/17c Measure of Variation: how evenly data is spread out We will calculate 2 MoVs: 1. Range: maximum - minimum 2. Interquartile Range (IQR): Q3 – Q1 1. Data: a) Range: 7-2 = 5
65 9.4 and 10.4 Notes: Measures of Variation and Box-and-Whisker Plots 4/17c Measure of Variation: how evenly data is spread out We will calculate 2 MoVs: 1. Range: maximum - minimum 2. Interquartile Range (IQR): Q3 – Q1 1. Data: a) Range: 7-2 = 5 b) How to find IQR:
65 9.4 and 10.4 Notes: Measures of Variation and Box-and-Whisker Plots 4/17c Measure of Variation: how evenly data is spread out We will calculate 2 MoVs: 1. Range: maximum - minimum 2. Interquartile Range (IQR): Q3 – Q1 1. Data: a) Range: 7-2 = 5 b) How to find IQR: List data least to greatest:
65 9.4 and 10.4 Notes: Measures of Variation and Box-and-Whisker Plots 4/17c Measure of Variation: how evenly data is spread out We will calculate 2 MoVs: 1. Range: maximum - minimum 2. Interquartile Range (IQR): Q3 – Q1 1. Data: a) Range: 7-2 = 5 b) How to find IQR: List data least to greatest: 2, 2, 2, 3, 5, 7
65 9.4 and 10.4 Notes: Measures of Variation and Box-and-Whisker Plots 4/17c Measure of Variation: how evenly data is spread out We will calculate 2 MoVs: 1. Range: maximum - minimum 2. Interquartile Range (IQR): Q3 – Q1 1. Data: a) Range: 7-2 = 5 b) How to find IQR: List data least to greatest: 2, 2, 2, 3, 5, 7 Find median
65 9.4 and 10.4 Notes: Measures of Variation and Box-and-Whisker Plots 4/17c Measure of Variation: how evenly data is spread out We will calculate 2 MoVs: 1. Range: maximum - minimum 2. Interquartile Range (IQR): Q3 – Q1 1. Data: a) Range: 7-2 = 5 b) How to find IQR: List data least to greatest: 2, 2, 2, 3, 5, 7 Find median
65 9.4 and 10.4 Notes: Measures of Variation and Box-and-Whisker Plots 4/17c Measure of Variation: how evenly data is spread out We will calculate 2 MoVs: 1. Range: maximum - minimum 2. Interquartile Range (IQR): Q3 – Q1 1. Data: a) Range: 7-2 = 5 b) How to find IQR: List data least to greatest: 2, 2, 2, 3, 5, 7 Find median 2.5
65 9.4 and 10.4 Notes: Measures of Variation and Box-and-Whisker Plots 4/17c Measure of Variation: how evenly data is spread out We will calculate 2 MoVs: 1. Range: maximum - minimum 2. Interquartile Range (IQR): Q3 – Q1 1. Data: a) Range: 7-2 = 5 b) How to find IQR: List data least to greatest: 2, 2, 2, 3, 5, 7 Find median 2.5 Find Q1 – median of bottom half
65 9.4 and 10.4 Notes: Measures of Variation and Box-and-Whisker Plots 4/17c Measure of Variation: how evenly data is spread out We will calculate 2 MoVs: 1. Range: maximum - minimum 2. Interquartile Range (IQR): Q3 – Q1 1. Data: a) Range: 7-2 = 5 b) How to find IQR: List data least to greatest: 2, 2, 2, 3, 5, 7 Find median 2.5 Find Q1 – median of bottom half
65 9.4 and 10.4 Notes: Measures of Variation and Box-and-Whisker Plots 4/17c Measure of Variation: how evenly data is spread out We will calculate 2 MoVs: 1. Range: maximum - minimum 2. Interquartile Range (IQR): Q3 – Q1 1. Data: a) Range: 7-2 = 5 b) How to find IQR: List data least to greatest: 2, 2, 2, 3, 5, 7 Find median 2.5 Find Q1 – median of bottom half Find Q3 – median of top half
65 9.4 and 10.4 Notes: Measures of Variation and Box-and-Whisker Plots 4/17c Measure of Variation: how evenly data is spread out We will calculate 2 MoVs: 1. Range: maximum - minimum 2. Interquartile Range (IQR): Q3 – Q1 1. Data: a) Range: 7-2 = 5 b) How to find IQR: List data least to greatest: 2, 2, 2, 3, 5, 7 Find median 2.5 Find Q1 – median of bottom half Find Q3 – median of top half
65 9.4 and 10.4 Notes: Measures of Variation and Box-and-Whisker Plots 4/17c Measure of Variation: how evenly data is spread out We will calculate 2 MoVs: 1. Range: maximum - minimum 2. Interquartile Range (IQR): Q3 – Q1 1. Data: a) Range: 7-2 = 5 b) How to find IQR: List data least to greatest: 2, 2, 2, 3, 5, 7 Find median 2.5 Find Q1 – median of bottom half Find Q3 – median of top half IQR: 5 - 2
65 9.4 and 10.4 Notes: Measures of Variation and Box-and-Whisker Plots 4/17c Measure of Variation: how evenly data is spread out We will calculate 2 MoVs: 1. Range: maximum - minimum 2. Interquartile Range (IQR): Q3 – Q1 1. Data: a) Range: 7-2 = 5 b) How to find IQR: List data least to greatest: 2, 2, 2, 3, 5, 7 Find median 2.5 Find Q1 – median of bottom half Find Q3 – median of top half IQR: 5 – 2 = 3
2. Range: 13 – 1 = 12 IQR: 1, 2, 8, 9, 9, 10, 11, 12, 12, 13
2. Range: 13 – 1 = 12 IQR: 1, 2, 8, 9, 9, 10, 11, 12, 12, 13 Median: 9.5
2. Range: 13 – 1 = 12 IQR: Q1 1, 2, 8, 9, 9, 10, 11, 12, 12, 13 Median: 9.5
2. Range: 13 – 1 = 12 IQR: Q3 Q1 1, 2, 8, 9, 9, 10, 11, 12, 12, 13 Median: 9.5
2. Range: 13 – 1 = 12 IQR: Q3 Q1 1, 2, 8, 9, 9, 10, 11, 12, 12, 13 Median: 9.5 IQR: 12 – 8
2. Range: 13 – 1 = 12 IQR: Q3 Q1 1, 2, 8, 9, 9, 10, 11, 12, 12, 13 Median: 9.5 IQR: 12 – 8 = 4
Outlier: a data value that is much larger or much smaller than the other values.
Outlier: a data value that is much larger or much smaller than the other values. 3. Identify any outliers in the data set:
Outlier: a data value that is much larger or much smaller than the other values. 3. Identify any outliers in the data set shown: 8
Outlier: a data value that is much larger or much smaller than the other values. 3. Identify any outliers in the data set shown: 8 4. Write an example of an outlier for the data shown:
Box-and-Whisker Plot: represents data along a number line by using the minimum, maximum, median, Q1, and Q3.
Data for Box-and-Whisker Plot • Statistical Question: How many PENCILS are in your pencil pouch? • (Take 30 seconds to determine your answer)
Data for Box-and-Whisker Plot • Statistical Question: How many (first) cousins do you have? • (Take 1 minute to determine your answer)
67 TB416 #8-14 even and TB463 #6, 10 (submit online) 4/17
Wrap Up • How do you find range? • How do you find Q1? • How do you find Q3? • How do you find IQR? • What is an outlier? • How do you find mean? • How do you find median? • How do you find mode? • What is a peak on a dot plot? • What is a statistical question?