Download
1 / 32
340 likes | 514 Views
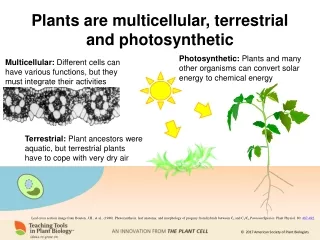
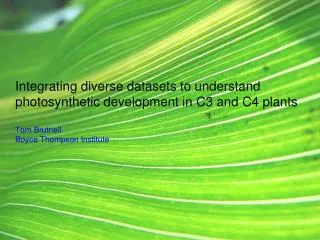
Integrating diverse datasets to understand photosynthetic development in C3 and C4 plants . Tom Brutnell Boyce Thompson Institute. Why iPlant and not iBrain?.

E N D
Integrating diverse datasets to understand photosynthetic development in C3 and C4 plants Tom Brutnell Boyce Thompson Institute
Why iPlant and not iBrain? • World population is expected to reach 9 billion by 2050 (currently approx. 7 billion) = more mouths to feed, cars to fuel and bodies to clothe • We are near or past peak oil production = food production is more expensive (fertilizer and tractors) • Global warming is reshaping land use (bioenergy) and contributing to a more unpredictable environment Urgent need to develop the NextGen of food, feed and bioenergy crops
Global food security • In 46 developing countries food prices are higher than 12 months ago, despite global recession • In sub-Saharian Africa price of maize, millet and sorghum are at all-time highs • Major agronomic disaster (e.g. drought in China) could have serious consequences on food supply
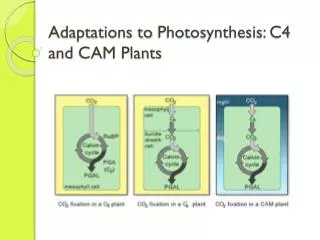
M BS C5 Photosynthesis: C3 to C4 2xC3 From website of Donald Ort http://www.life.uiuc.edu/pru/labs/ort.html
Models for C4 photosynthetic development C3 state C4 state A) repression of gene expression through novel trans-factor B) Enhanced expression in BS or M through novel cis-element
Models for C4 photosynthetic development C3 state C4 state C) Destabilization of protein due to novel cellular environment (e.g. redox, missing complex) D) Expression directly or indirectly linked to metabolite Y
Using monocot leaf gradient to find networks and regulatory points for C4 Tests Modify regulatory points Perturb environment Modeling Expression/regulation Metabolism Comparisons developmental stages BS vs. M cells (LCM) C3 and C4 Developmental inventories transcripts proteins metabolites physiology anatomy Physiology & cell biology—Bob Turgeon (Cornell) Photosynthesis—Richard Peterson (CAES) Transcriptomics—Tom Brutnell (Boyce Thompson Inst) Proteomics—Klaas van Wijk (Cornell) Laser microdissection—Tim Nelson (Yale) Metabolites—Alisdair Fernie (MPI-Potsdam Golm) Statistics—Peng Liu (Iowa St U) Informatics—Qi Sun (Cornell), Pankaj Jaiswal (Oregon St ) Modeling, systems—Chris Meyers (Cornell)
Ligule of L2 Where should we sample? Standardization of the base-to-tip leaf gradients • extent of growth (time) • anatomical features • gene markers • sink-source transition Maize inbred B73, 9 dap L3 L2 L3 L1
Locating sink-source transition Sink-source transition is site of global changes in physiology, expression, anatomy Label from L3 tip from L1 Label 5 min Chase 1 hour Max chl accumulation Plastid diffn complete Sink-Source transition complete L2 ligule Zone of import limited to below L2 ligule • L2 ligule is an accurate physical marker for sink-source transition in L3 • Ligule site confirmed accurate for both maize and rice L3
Gene expression markers along gradient Sheath Calibrated gradient with 20 expression markers (RT-PCR) PPdK • PS genes increase from S-S transition CycD2 • Cell cycle genes only near base
Developmental Inventories—Common samples for all inventories Leaf Section 9 Section 1 Section 4 Section 14 LCM Source-sink Histology Bundle sheath cell Mesophyll cell RNA isolated RNA isolation and amplification Metabolite extraction Total RNA mRNA aRNA Primary metabolites Secondary metabolites Small RNA library RNA-seq library Metabolites profiling Solexa libraries sequencing qPCR validation Solexa expression analysis Proteomics Systems biology
Developmental Inventories—dynamics of individual transcripts RNA-seq profiles • Resolves closely related members of a gene family • Identifies alternative splicing patterns • Allele-specific transcription • Less dependent on gene annotation • More dynamic fold change novel transcript Splice variants by stage
MapMan Pathway Viewer- see Bjoern Base Tip Adapted MapMan view: does not show multiple stages, cell types, C4
Mesophyll Cell Bundle Sheath Cell PEP Pyr Pyr MEP4 ATP ADP ATP ADP MEP3 PPDK Chloroplast PGA CO2 Pyr OAA PPT PGA PEP PEP PPT? ATP NADPH OAA PRP ATP CA Xyl-5P CO2 HCO3- Glu GAPB AMP NADP+ AMP Mitochondrion OAA OAA AKG Mal DAP ASP TPT DAP PEPCase Chloroplast Starch Synthesis Maltose DIT2 AKG Sucrose Mal Mal DIT1 ASP ASP PPDK: Pyruvate Orthophospho-Dikinase PRP: PPDK – regulatory protein PEPCase: PhosphoenolPyruvate Carboxylase CA: Carbonic Anhydrase NADP-MDH: NADP – malate dehydrogenase TPT: Phosphate/triose-phosphate translocator NADP-ME: NADP – Malic enzyme PPT: Phosphate/PhosphoenolPyruvate translocator DIT: 2-oxoglutarate/malate translocator MEP: Envelope protein PEPCK:PhosphoenolPyruvate carboxykinase Rubisco: Ribulose-1,5-bisphosphate carboxylase/oxygenase RCA: Rubisco activase PRK: Phosphoribulokinase RPI: ribose-5-phosphate isomerase TKL: Transketolase SBP: Sedoheptulose-1,7-bisphosphatase FBA: Fructose-bisphosphate aldolase PGK: Phosphoglycerate kinase TPI: Triosephosphate isomerase GAPA: Glyceraldehyde-3-phosphate dehydrogenase A GAPB: Glyceraldehyde-3-phosphate dehydrogenase B ASP-TS: Aspartate Aminotransferase DAP: dihydroxyacetone phosphate ASP-TS ASP-TS MEP1? PEPCK NADPH Glu Lin 02/2009 AATP1 NADP-ME TKL RCA PRK NADP-MDH SBP FBP TKL PGK Rubisco PGK TPI RPI TPI RPE FBA GAPA MEX1 NADP+
NADPH NADP+ δ δ FNR1 ADP + Pi ADP + Pi ATP ATP hv PQH2 FD Lhcb 1-6 Lhca 1-4 b b b b ε ε H2O H2 +O2 H+ PC ATP synthase PSII PSI Cyt b6f complex a a cytosol α α α α 3H+ 3H+ β β FNR2 C12 C12 FD γ γ Bundle Sheath thylakoid membrane Lhca 1-4 PQH2 O H+ H+ PC Lumen ATP synthase PSI NDH complex Cyt b6f complex N M PsbC PsbB stroma H NdhL cytosol NdhJ M, I, L, O, D, G M, I, L, O, D, G Mesophyll J, K, W, I, E, F C, E, H, J, K C, E, H, J, K L, S, N, H, M, X thylakoid membrane Cyt b6 Cyt b6 Lin 02/2009 IV IV Cyt f Cyt f NdhF NdhD NdhA PsbD PsbA NdhB ISPb ISPb PsaA PsaA PsaB PsaB ISPa ISPa PsbP PsbO Lumen PsaN PsaN PsaF PsaF stroma PsbQ PsbR
PageMan view of developmental gradient, BS/M specificity BS/M Down in M 1.5 gradient Up in BS
TFs clustered by developmental dynamics tip base -1 4 A B C D E F G H I
TF types in dynamic classes A B C D E F G H I
Input gene ID XXXX 0h 6h 12h 18h 24h
Gene expression base -1 +4 tip “a slider view” 0h 6h 12h 18h 24h
Gene expression base -1 +4 tip “a slider view” 0h 6h 12h 18h 24h
Gene expression base -1 +4 tip “a slider view” 0h 6h 12h 18h 24h
Gene expression base -1 +4 tip “a slider view” 0h 6h 12h 18h 24h
Molecular inventories correspond well to leaf gradient features Plastid differentiation Cell division Cell wall Polymers Plasmodesmata Cell patterning Respiration Transcr. factors PS light & dark reactions (C4) PS Pigments PS Activities PS metabolites Plastid number Transcription factors L3 base tip Sink-Source transition L2 ligule