Download
1 / 18
200 likes | 668 Views
STATISTICAL FORECASTING OF OPTICAL TURBULENCE. Frank Ruggiero and Artie Jackson Air Force Research Laboratory Hanscom AFB, MA. Objective. To develop a real-time optical turbulence prediction approach for upper-troposphere – lower stratosphere Stably stratified flows

E N D
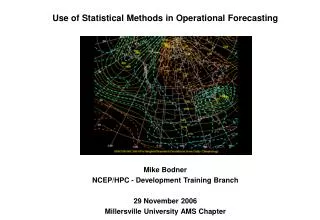
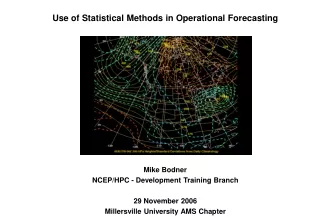
STATISTICAL FORECASTING OF OPTICAL TURBULENCE Frank Ruggiero and Artie Jackson Air Force Research Laboratory Hanscom AFB, MA
Objective • To develop a real-time optical turbulence prediction approach for upper-troposphere – lower stratosphere • Stably stratified flows • In support of developing directed-energy weapon and communication systems • To satisfy necessary domains, must rely on numerical weather prediction model fields as input
Optical Turbulence • Phenomenon which makes stars “twinkle” • Turbulence occurring in layers with a length scale of a few cm to ~100m in upper troposphere and lower stratosphere • Caused by turbulent mechanical mixing which creates small-scale temperature and refractive index inhomogeneities • Acts like small lenses which tilt and defocus light as it is dwelling its target --------Atmosphere-------- Time Averaged Instantaneous Vacuum
Optical Turbulence Structure Cn2 varies with atmospheric conditions by orders of magnitude Humidity Direction • This single layer of high turbulence dominates light propagation • This layer is associated with the tropopause and jet stream • Flow over topography and convection are also sources of optical turbulence • Tropopause is also a factor Stratosphere Tropopause Jet Stream Troposphere Temperature Speed Index of Refraction Structure Constant Index of Refraction Structure Constant
Outline • Review of Existing AFRL Optical Turbulence Modeling Efforts • Dewan • Jackson • Description of Latest Approach
Tatarski’s Formulation of Optical Turbulence Where: Reference: Tatarski, V. I., 1961: Wave Propagation in a Turbulent Medium, McGraw-Hill.
Outer Length Scale - Dewan • Dewan et al. (1993) uses two relationships: • Troposphere: • Stratosphere: • where : Reference: Dewan, E. M., R. E. Good, B. Beland, and J. Brown, 1993: A Model for Cn2 (Optical Turbulence) Profiles using Radiosonde Data. Phillips Laboratory Technical Report, PL-TR-93-2043. ADA 279399.
Outer Length Scale - Jackson • Jackson (2004) used thermosonde-derived values of Cn2 in Tatarski’s equation, solved for L04/3 and then correlated L04/3 with vertical wind shear and temperature gradients: • Troposphere: • Stratosphere: Reference: Jackson, A., 2004: Modified-Dewan Optical Turbulence Parameterizations. Air Force Research Laboratory Technical Report, AFRL-VS-HA-TR-2004-1116. ADA 432901.
October 2003 21-28 Oct 12 thermosonde profiles over 8 days 0.5° Global data used for initial and lateral boundary conditions WRF run with 41 vertical levels & nests of x = 15 km & 5 km Forecasts were evaluated 12-18 hours into model integration Verification: Holloman AFB, NM
Results: Rytov Variances Relationship of Observed Rytov Variance to Forecast
Results: Categorical Forecasts – Dewan 45% Correct 14% Under-forecast 41% Over-forecast Low < 0.15 0.15 ≥ Moderate ≤ 0.25 High > 0.25
Results: Categorical Forecasts – Jackson 50% Correct 41% Under-forecast 9% Over-forecast Low < 0.15 0.15 ≥ Moderate ≤ 0.25 High > 0.25
Results: Probability of Detection &False Alarm Rate for Rytov Variance
Current Situation in Optical Turbulence Prediction • Jackson parameterization significantly improved over Dewan • Dewan and Jackson parameterizations show opposite biases • Could be used in an ensemble approach to bracket optical turbulence • Accuracy and precision of forecasts still needs to be improved
Development of Next Generation Optical Turbulence Prediction Algorithm • Expand number of dependent variables to examine • Single level variables • T, P, q, u, v, w, θ,….. • Powers of single level variables • T2, T4, …… • Vertical gradients • dt/dz, du/dz, RB, N, ….. • Squares and 2nd derivatives of vertical gradients • (dt/dz)2, d2t/dz2, …. • Products of variables • dV/dz*dT/dz, ….. • Other profile derived variables • Trop height, max wind, ….. • Horizontal gradients • Frontogenesis, horizontal deformation, …..
Development of Next Generation Optical Turbulence Prediction Algorithm • Expand the amount of data used in dependent data • Multiple locations • Multiple seasons • Over 250 profiles in database • Significant amount of data available for independent verification (~100 profiles) • Use Cn2 as forecast variable (not L) • Investigate advanced statistical approaches • Probability density functions • Bayesian approaches
Database Sample Analysis Combined Correlation of Shear and dT/dz with Cn2 Frequency of Shear and dT/dz Combinations Troposphere Stratosphere Tropopause
Conclusions • Since 2000 AFRL has shown improvement in the ability to predict optical turbulence • Statistics-based approaches viable • Further improvement in accuracy and prediction is needed • AFRL is working on improved statistical approaches that will: • Improve accuracy • Provide measure of forecast confidence

![Statistical Forecasting [Part 2]](https://cdn0.slideserve.com/1092555/statistical-forecasting-part-2-dt.jpg)

![Statistical Forecasting [Part 1]](https://cdn3.slideserve.com/6737421/statistical-forecasting-part-1-dt.jpg)