Download
1 / 10
100 likes | 243 Views
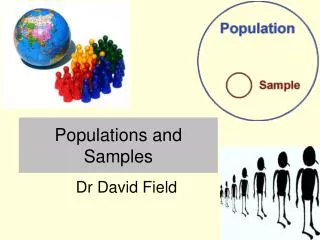
Probability and samples. Chapter 7. Who we care about. In research, we don’t make conclusions about individual people We make conclusions about what is true for most people we don’t care about individual scores We care about the mean score, across a group of people.

E N D
Probability and samples Chapter 7
Who we care about • In research, we don’t make conclusions about individual people • We make conclusions about what is true for most people • we don’t care about individual scores • We care about the mean score, across a group of people
Thinking back to distributions of individual scores • Scores go on the X-axis • Prevalence goes on the Y-axis • May be skewed • May be normally distributed • Can use to determine how likely it would be to pull out a score in a certain region from that group
Thinking in terms of sample means • Can select many different samples from a population, just as you can select many different individuals from a group • From a population of 1000, you could select many different samples of 10 people, and you could calculate a mean for each of those samples • (clearly, you never would do this, but you could)
Distribution of sample means • Similar to distribution of individual scores • On Y axis = prevalence • On X axis = possible means of samples of a given size
A crucial difference • Distributions of individual scores can take on any shape • Distributions of sample means will always be normally distributed • Theoretical distribution – never actually created, but the idea of it is a crucial basis for inferential statistics • Different distribution for each sample size
Comparing distribution of individual scores and sampling distribution of the mean • Central limit theorem: the mean of all individual scores will equal the mean of the means of all the samples of a given size that can be selected from that group of individual scores • Like distribution of individual scores, there is variability • More variability among individual scores than in the distribution of sample means
Quantifying variability of the distribution of sample means • Just like standard deviation, captures average distance from the mean • average distance between means of samples of a given size and the mean of the population • Standard error of the mean: AKA standard error = standard deviation of the distribution of sample means • sm = s/sqrt(n) • Usually referred to in journals as SE or SEM
Extending the comparison between types of distributions • We can determine the probability of selecting a sample with different levels of oddness (defined as distance from the mean of the population that the sample is from), just as we did for individual people • Convert mean of sample to z-score: • Z = (X-m)/s • Z of sample = (M-m)/sm • Number of standard errors that the mean of the sample is away from the mean of the population • Use unit-normal table to determine likelihood of selecting such a sample, given the population
To keep in mind • Just as there is variability from person to person, there is variability from sample to sample • The more variability, the odder the person or sample, you may obtain – just by chance • Using z-scores, you can figure out how likely it is to select individuals or samples that are different distances from what you think the mean of the population is • Remember to think of all the new terms and equations in English