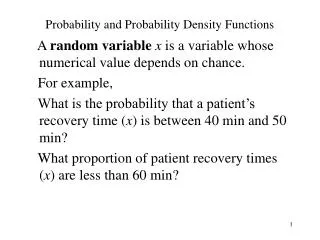
Probability and Samples
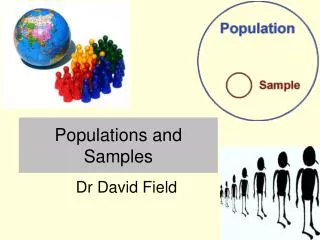
Probability and Samples. Sampling Distributions Central Limit Theorem Standard Error Probability of Sample Means. Inferential Statistics. Probability. tomorrow and beyond. Population. Sample. last week and today. last Thursday. today.

Probability and Samples
E N D
Presentation Transcript
Probability and Samples • Sampling Distributions • Central Limit Theorem • Standard Error • Probability of Sample Means
Inferential Statistics Probability tomorrow and beyond Population Sample last week and today
last Thursday today When we take a sample from a population we can talk about the probability of - getting a certain type of individual when we sample once - getting a certain type of sample mean when n>1
6 5 frequency 4 3 2 1 raw score 70 10 20 30 40 50 60 Distribution of Individuals in a Population p(X > 50) = ?
6 5 frequency 4 3 2 1 raw score 70 10 20 30 40 50 60 Distribution of Individuals in a Population 1 = 0.11 p(X > 50) = 9
6 5 frequency 4 3 2 1 raw score 70 10 20 30 40 50 60 Distribution of Individuals in a Population p(X > 30) = ?
6 5 frequency 4 3 2 1 raw score 70 10 20 30 40 50 60 Distribution of Individuals in a Population 6 = 0.66 p(X > 30) = 9
Distribution of Individuals in a Population 6 normally distributed = 40, = 10 5 frequency 4 3 2 1 70 10 20 30 40 50 60 p(40 < X < 60) = ?
Distribution of Individuals in a Population 6 normally distributed = 40, = 10 5 frequency 4 3 2 1 70 10 20 30 40 50 60 p(40 < X < 60) =p(0 < Z < 2) = 47.7%
normally distributed = 40, = 10 Distribution of Individuals in a Population 6 5 frequency 4 3 2 raw score 1 70 10 20 30 40 50 60 p(X > 60) = ?
Distribution of Individuals in a Population 6 normally distributed = 40, = 10 5 frequency 4 3 2 raw score 1 70 10 20 30 40 50 60 p(X > 60) =p(Z > 2) = 2.3%
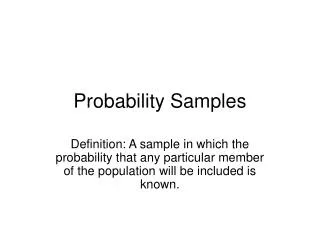
For the preceding calculations to be accurate, it is necessary that the sampling process be random. A random sample must satisfy two requirements: Each individual in the population has an equal chance of being selected. If more than one individual is to be selected, there must be constant probability for each and every selection (i.e. sampling with replacement).
Distribution of Sample Means • A distribution of sample means is: • the collection of sample means for all the possible random samples of a particular size (n) that can be obtained from a population.
Population 6 5 frequency 4 3 2 1 raw score 8 7 9 1 2 3 4 5 6
Distribution of Sample Means from Samples of Size n = 2 Sample # Scores Mean ( )
Distribution of Sample Means from Samples of Size n = 2 6 5 frequency 4 3 2 1 8 7 9 1 2 3 4 5 6 sample mean We can use the distribution of sample means to answer probability questions about sample means
Distribution of Sample Means from Samples of Size n = 2 6 5 frequency 4 3 2 1 8 7 9 1 2 3 4 5 6 sample mean p( > 7) = ?
Distribution of Sample Means from Samples of Size n = 2 6 5 frequency 4 3 2 1 8 7 9 1 2 3 4 5 6 sample mean 1 p( > 7) = = 6 % 16
6 = 5, = 2.24 5 frequency 4 3 2 X = 5, X = 1.58 1 raw score 8 7 9 1 2 3 4 5 6 Distribution of Individuals in Population Distribution of Sample Means 6 5 frequency 4 3 2 1 8 7 1 2 3 4 5 6 9 sample mean
6 5 frequency 4 3 X = 5, X = 1.58 2 1 raw score 8 7 9 1 2 3 4 5 6 p(X> 7) = 6% , for n=2 Distribution of Individuals = 5, = 2.24 Distribution of Sample Means 6 5 frequency 4 3 2 p(X > 7) = 25% 1 8 7 1 2 3 4 5 6 9 sample mean
A key distinction Population Distribution – distribution of all individual scores in the population Sample Distribution – distribution of all the scores in your sample Sampling Distribution – distribution of all the possible sample means when taking samples of size n from the population. Also called “the distribution of sample means”.
6 = 5, = 2.24 5 frequency 4 3 2 X = 5, X = 1.58 1 raw score 8 7 9 1 2 3 4 5 6 Distribution of Individuals in Population Distribution of Sample Means 6 5 frequency 4 3 2 1 8 7 1 2 3 4 5 6 9 sample mean
Distribution of Sample Means 6 5 frequency 4 3 2 1 8 7 1 2 3 4 5 6 9 sample mean Things to Notice The sample means tend to pile up around the population mean. The distribution of sample means is approximately normal in shape, even though the population distribution was not. The distribution of sample means has less variability than does the population distribution.
1 p( X > 7) = = 2 % 64 X = 5, X = 1.29 Distribution of Sample Means from Samples of Size n = 3 24 22 20 18 frequency 16 14 12 10 8 6 4 2 8 7 9 1 2 3 4 5 6 sample mean
Distribution of Sample Means As the sample gets bigger, the sampling distribution… stays centered at the population mean. becomes less variable. becomes more normal.
will have a mean of will have a standard deviation of will approach a normal distribution as n approaches infinity Central Limit Theorem For any population with mean and standard deviation , the distribution of sample means for sample size n …
Notation the mean of the sampling distribution the standard deviation of sampling distribution (“standard error of the mean”)
Standard Error • The “standard error” of the mean is: • The standard deviation of the distribution of sample means. • The standard error measures the standard amount of difference between x-bar and that is reasonable to expect simply by chance. SE =
Standard Error • The Law of Large Numbers states: • The larger the sample size, the smaller the standard error. This makes sense from the formula for standard error …
6 = 5, = 2.24 5 frequency 4 3 2 X = 5, X = 1.58 1 raw score 8 7 9 1 2 3 4 5 6 Distribution of Individuals in Population Distribution of Sample Means 6 5 frequency 4 3 2 1 8 7 1 2 3 4 5 6 9 sample mean
24 22 20 18 frequency 16 14 12 10 8 X = 5X = 1.29 6 4 2 8 7 9 1 2 3 4 5 6 sample mean Sampling Distribution (n = 3)
notice Clarifying Formulas Distribution of Sample Means Population Sample
will have a mean of will have a standard deviation of will approach a normal distribution as n approaches infinity What does this mean in practice? Central Limit Theorem For any population with mean and standard deviation , the distribution of sample means for sample size n …
small n large n normal population non-normal population Practical Rules Commonly Used: 1. For samples of size n larger than 30, the distribution of the sample means can be approximated reasonably well by a normal distribution. The approximation gets better as the sample size n becomes larger. 2. If the original population is itself normally distributed, then the sample means will be normally distributed for any sample size.
Probability and the Distribution of Sample Means The primary use of the distribution of sample means is to find the probability associated with any specific sample.
Probability and the Distribution of Sample Means Example: Given the population of women has normally distributed weights with a mean of 143 lbs and a standard deviation of 29 lbs, if one woman is randomly selected, find the probability that her weight is greater than 150 lbs. if 36 different women are randomly selected, find the probability that their mean weight is greater than 150 lbs.
Given the population of women has normally distributed weights with a mean of 143 lbs and a standard deviation of 29 lbs, Population distribution z = 150-143 = 0.24 29 0.4052 = 143 150 = 29 0.24 0 if one woman is randomly selected, find the probability that her weight is greater than 150 lbs.
Given the population of women has normally distributed weights with a mean of 143 lbs and a standard deviation of 29 lbs, Sampling distribution z = 150-143 = 1.45 4.33 0.0735 = 143 150 = 4.33 1.45 0 if 36 different women are randomly selected, find the probability that their mean weight is greater than 150 lbs.
Probability and the Distribution of Sample Means Example: Given the population of women has normally distributed weights with a mean of 143 lbs and a standard deviation of 29 lbs, if one woman is randomly selected, find the probability that her weight is greater than 150 lbs. if 36 different women are randomly selected, find the probability that their mean weight is greater than 150 lbs.
Example: Given a population of 400 automobile models, with a mean horsepower = 105 HP, and a standard deviation = 40 HP, 40 20 8 Practice What is the standard error of the sample mean for a sample of size 1? What is the standard error of the sample mean for a sample of size 4? What is the standard error of the sample mean for a sample of size 25?
.35 .23 .03 Practice Example: Given a population of 400 automobile models, with a mean horsepower = 105 HP, and a standard deviation = 40 HP, if one model is randomly selected from the population, find the probability that its horsepower is greater than 120. If 4 models are randomly selected from the population, find the probability that their mean horsepower is greater than 120 If 25 models are randomly selected from the population, find the probability that their mean horsepower is greater than 120