Download
1 / 26
310 likes | 630 Views
Organizing epidemiologic data makes large datasets manageable, allowing for analysis of relationships between disease and exposure, trends, and communication. Tables arranged in rows and columns help show patterns, trends, relationships, and differences. Different types of tables like One-Variable, Two- and Three-Variable, and Two-By-Two tables provide in-depth analysis for targeting interventions. Using class intervals and graphs/charts can help visualize data, while mapping coordinates can aid in outbreak investigations and intervention planning. The benefits of organizing data include summarizing large datasets, displaying analysis visually, and increasing knowledge.

E N D
Importance of Data Organization • Makes large data sets manageable • Allows for analysis • Relationships between disease and exposure • Trends • Communication
Tables • Arranged in rows and columns • Can show patterns, trends, relationships or differences • Simplicity • Self-explanatory
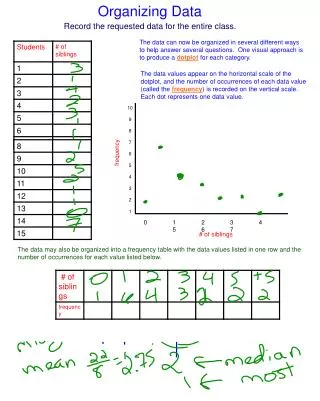
One-Variable Table • Frequency Distribution • 1st Column shows category • Sex = Male or Female • 2nd Column shows Number in each category • Can have additional columns • Percent • Cumulative percent
Two- and Three-Variable Tables • More in depth analysis • Be careful not to get to complicated • Look for associations • 3rd variable allows for stratification
Ill Well Total Exposed Unexposed Total N Use of Two-By-Two Tables • Calculate association between disease and exposure a b c d ad/bc = Odd Ratio Relative Risk
Odd Ratio = 100 x 2340/89 x 811 = 234000/72179 OR = 3.24 Exercise 4.1B on page 212
OR = 12 x 17/2 x 5 = 204/10 OR = 20.4 Answer to 4.1B
Class intervals • May want to group data • Split variables into Categories • Age • Continuous (1, 2, 3, etc….) • Categorical (<1, 1-5, 6-10, etc….) • Watch out for overlap
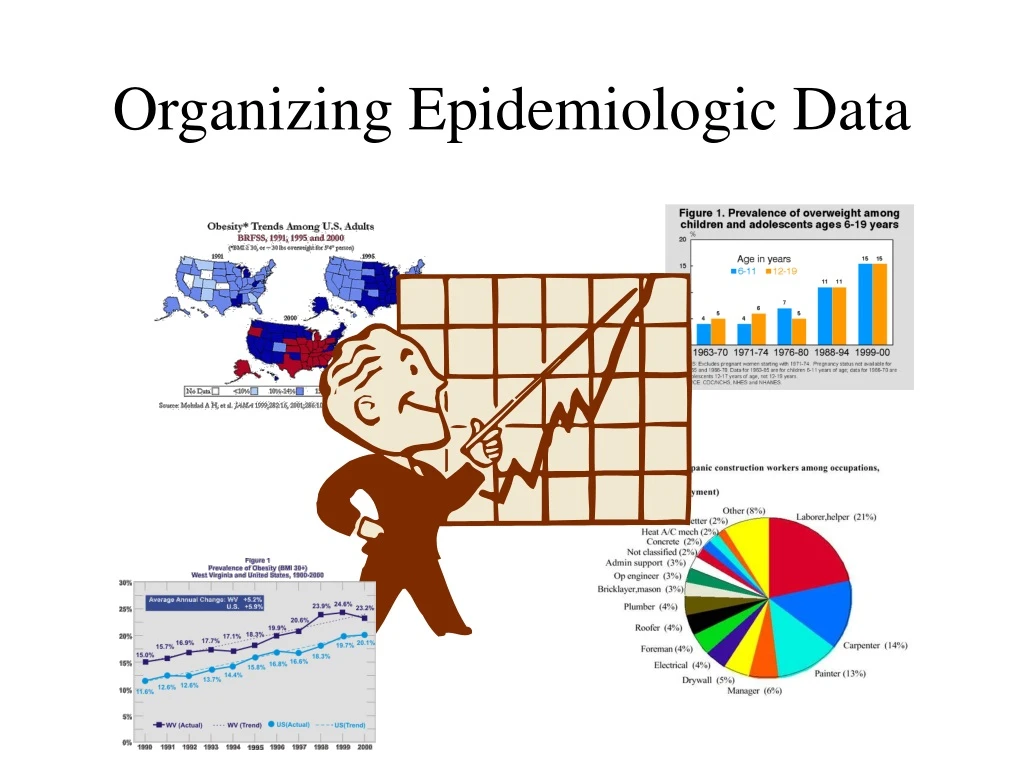
Graphs/Charts • Shows data visually • Patterns, trends similarities and differences • Audience remembers • Many types • Line • Histogram • Bar • Pie
Mapping • Use of Coordinates • Shows geographic location/distribution • Can be important in • Outbreak investigation • Health assessments • Intervention planning/evaluation
Mapping in Rabies Control • Background on raccoon strain rabies in WV • Oral Rabies Vaccine Project (ORV) • Active Surveillance • Rabies Coordinates • Establishing the ORV barrier
Benefits of Organizing Data • Summarizes large data sets • Displays Analysis • Visual representation of trends • Education • Funds • Increase knowledge