Download
1 / 18
190 likes | 383 Views
a Spatial Microsimulation Model of Co-Morbidity: First Results. Dr Karyn Morrissey, Dr Ferran Espuny , Dr Paul Williamson. Project Overview & Goals.

E N D
a Spatial Microsimulation Model of Co-Morbidity: First Results Dr Karyn Morrissey, DrFerranEspuny, Dr Paul Williamson.
Project Overview & Goals • Identify the underlying determinants of co-morbidity for CVD, diabetes & obesityat both the national and health authority region in England using the HSE • Using spatial microsimulation, develop baseline small-area population estimates of co-morbidity outcomes for England • Validate the baseline estimates of health service utilisation associated with those co-morbidities using administrative data supplied by East Kent Health Trust • Inform health policy, using East Kent as a case study area identifying areas of apparent under/over-utilisation Develop a model of co-morbidity between CVD, diabetes & obesity at a small area level for England
Non-communicable Diseases (NCD) • In developed countries cardiovascular disease (CVD), diabetes and obesity are major contributors to the overall burden of chronic disease. • In 2010, 48% of NCD deaths were caused by CVD, while diabetes was directly responsible for 3.5% of NCD deaths (World Health Statistics, 2012). • Whilst; Approximately 1.5 billion of the global adult population are overweight (WHO, 2011) . • Along with an increased prevalence of CVD, diabetes and obesity as single morbidities • Growing body of evidence that individuals are increasingly at risk of two or more of these diseases
Research on comorbidity • Responding to increased rates of comorbidity and the knowledge that comorbidity significantly increases mortality rates and decreases functional status and quality of life, the study of comorbidity, has increased over the last decade: • Clinician led; focused on: • Identifying the most prevalent groupings of illnesses that demonstrate comorbidity, particularly among the elderly population • CVD: 2 of the major risk factors are obesity and diabetes • Close link between obesity and diabetes is well established • CVD is listed as the cause of death for 65% of persons with diabetes • Based on revealed preference; hospital admissions data • Standardised at best by age and sex
Such a focus… • Ignores the accepted empirical evidence that an individual’s health is the outcome of multifaceted processes rather than age or initial health status alone (Morrissey et al., 2013). • Ill-health is not only a product of aging, but instead individual level circumstances. • Thus, this project assumes that similar to single morbidities, comorbidity is the result of complex interrelationships between differing health conditions and shared • Demographic, • Socioeconomic and; • Environmental risk factors
Goal 1 – Outcome Multinomial Logistic Model • Identify the underlying determinants of co-morbidity for CVD, diabetes & obesityin England using the Health Survey of England • Gender and Marital Status significant, but not as influential as other variables (standardising by age and sex is therefore not sufficient) • Black population presents a high diabetes (and diabetes-related co-morbidity) risk • Asian population presents a high diabetes risk but low obesity (BMI threshold debate) • Lowest disease risk for individuals with a high income, owning their own home, in-work and having a degree • Obesity (and related) higher risk for ex-regular smokers but lower risk for smokers
All of these factors are differentiated across different spaces And the HSE has very coarse spatial scales: SHA
Goal 2 – Including Geography • Develop baseline small-area population estimates of co-morbidity outcomes for England using: Spatial microsimulation • Combine data from: • Health Survey for England (HSE 2008-2011): Social Health Authority (SHA) spatial scale • Census of Population (CoP 2011, recent release): • Target Geography – Lower Super Output Area level (LSOA)
Project Innovation #1 Issue # 1: accessing data at different geographical scales • Both CASWEB and INFUSE are ‘point-and-click’ interfaces aimed primarily at the novice user. • Neither offers the ability to save complex extraction queries spanning multiple geographies, tables and cells for re-running or amendment. • This severely impairs their utility for researchers. Infuser We developed a prototype in R software for • Downloading/creating a geography lookup for England area levels • Searching census tables by contents • Getting the census counts at OA level • Obtaining LSOA statistics by aggregation of the OA counts • Received an additional £15,000 + £48,000 from the UKDS Innovation fund to finalise Infuser
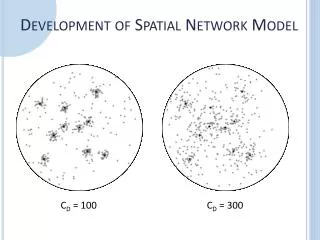
Project Innovation #2 Issue # 2: Wish to use simulated annealing – historically very slow process (SMILE; 3 months) • Trialling a Combinatorial Optimization method • Global Optimisation (Espuny et al., 2014) • Speeds up current computational process • Allows us to test the effectiveness of potential matching constraints • a prior at different area levels • validate the effectiveness of using regression models to choose matching constraints • chose the most effective matching constraints relative to our simulated variable of interest
Project Innovation #3 • Issue # 3: Calibration • (Morrissey et al., 2013) used an external validation method: calibration through alignment • A hierarchical internal validation process will be conducted to ensure that the distribution of the single morbidity variables, CVD, Diabetes and Obesity are consistent across different levels of spatial aggregation • Calibration Data: • The national Quality and Outcomes Framework (QOF) was introduced as part of the new General Medical Services (GMS). • Participation by practices in the QOF is voluntary, though participation rates • Data related to our comorbidity research are, for each practice centre: the size of the list of patients, the Coronary Heart Disease Register, the Diabetes Mellitus (Diabetes) Register (ages 17+), the Obesity Register (ages 16+)
Pre calibration Results… • Non-Integer (Counts themselves should not change between integer and non integer)
Matching Constraints & Internal Validation The validation measures show a good (but not perfect) fit to the tables used as constraints and a poor fit to the non-used tables:
Simulation Results • Initial Validation (Pre-calibration) • Used Self Report General Health as a variable for calibration at the MSOA Level • Good match!
Overview for England One Plus Disease Two Plus Disease
Next Steps • Continue testing the algorithm • Validating the disease estimates using the NHS practice level data • Complete Project!
Acknowledgements • East Kent Hospital Trust our case partner • The ESRC Secondary Data Analysis Initiative for funding this research.