Download
1 / 1
10 likes | 117 Views
Figure 4. Nitrate-nitrogen with sension probe. Figure 3. Total Fe analysis at 510 nm. Figure 5. Nitrate-nitrogen and total Fe calibration curves. Water Quality Analysis of Tryon Creek State Park By Matthew J LaForce Environmental Chemistry II WQT134 Spring 07. Abstract

E N D
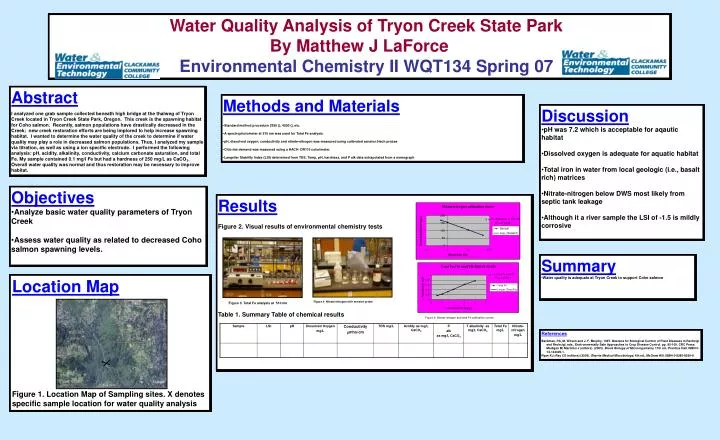
Figure 4. Nitrate-nitrogen with sension probe Figure 3. Total Fe analysis at 510 nm Figure 5. Nitrate-nitrogen and total Fe calibration curves Water Quality Analysis of Tryon Creek State Park By Matthew J LaForce Environmental Chemistry II WQT134 Spring 07 Abstract I analyzed one grab sample collected beneath high bridge at the thalweg of Tryon Creek located in Tryon Creek State Park, Oregon. This creek is the spawning habitat for Coho salmon. Recently, salmon populations have drastically decreased in the Creek; new creek restoration efforts are being implored to help increase spawning habitat. I wanted to determine the water quality of the creek to determine if water quality may play a role in decreased salmon populations. Thus, I analyzed my sample via titration, as well as using a ion specific electrode. I performed the following analysis: pH, acidity, alkalinity, conductivity, calcium carbonate saturation, and total Fe. My sample contained 0.1 mg/l Fe but had a hardness of 250 mg/L as CaCO3. Overall water quality was normal and thus restoration may be necessary to improve habitat. • Methods and Materials • Standard method procedure 2350 (), 4500 (), etc. • A spectrophotometer at 510 nm was used for Total Fe analysis • pH, dissolved oxygen, conductivity and nitrate-nitrogen was measured using calibrated sension Hach probes • Chlorine demand was measured suing a HACH DR110 colorimeter. • Langelier Stability Index (LSI) determined from TDS, Temp, pH, hardness, and P alk data extrapolated from a nomograph • Discussion • pH was 7.2 which is acceptable for aqautic habitat • Dissolved oxygen is adequate for aquatic habitat • Total iron in water from local geologic (i.e., basalt rich) matrices • Nitrate-nitrogen below DWS most likely from septic tank leakage • Although it a river sample the LSI of -1.5 is mildly corrosive • Objectives • Analyze basic water quality parameters of Tryon Creek • Assess water quality as related to decreased Coho salmon spawning levels. Results Figure 2. Visual results of environmental chemistry tests Table 1. Summary Table of chemical results • Summary • Water quality is adequate at Tryon Creek to support Coho salmon Location Map Figure 1. Location Map of Sampling sites. X denotes specific sample location for water quality analysis References Backman, PA, M. Wilson and J. F. Murphy. 1997. Bacteria for Biological Control of Plant Diseases in Rechcigl and Rechcigl, eds., Environmentally Safe Approaches to Crop Disease Control. pp. 95-109. CRC Press. Madigan M; Martinko J (editors). (2005). Brock Biology of Microorganisms, 11th ed., Prentice Hall. ISBN 0-13-144329-1. Ryan KJ; Ray CG (editors) (2004). Sherris Medical Microbiology, 4th ed., McGraw Hill. ISBN 0-8385-8529-9