Download
1 / 11
110 likes | 131 Views
North Creek Water Quality. Prepared by Jon Rogers and Carie McCoy. Dr. Jaffe’s Environmental Chemistry Lab Class January 21 st – February 3 rd , 2005. North Creek. Adjacent to the UWB/CCC Campus in the Sammamish Valley of King County, WA

E N D
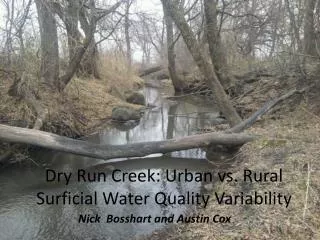
North Creek Water Quality Prepared by Jon Rogers and Carie McCoy
Dr. Jaffe’s Environmental Chemistry Lab ClassJanuary 21st – February 3rd, 2005
North Creek • Adjacent to the UWB/CCC Campus in the Sammamish Valley of King County, WA • Approximate latitude and longitude: 47o 45’ 21” N 122o 11’ 20”W • Upstream Site: East of exit number 24 off I-405 • Downstream Site: Past the Boardwalk in the UWB/CCC Wetlands
Goals • Determine if the wetland helps contribute to improved water quality. • To determine if North Creek complies with state standards.
Study Parameters • pH: effects chemical and biological processes which occur in an aquatic environment • Conductivity: measures ionic potential of the waterway • Temperature: influences rates of chemical and biological processes • Dissolved Oxygen (DO): concentration of oxygen which is in a dissolved form in the water • Stream Flow: volume of water moving over a designated point at a fixed period of time • Turbidity: measured amount of suspended sediments in the water • Nitrates: measure of nitrogen as nitrate (N03-N) in the water • Phosphates: measure of phosphorous as phosphate (PO4-P) in the water
Effects of Parameters • pH: if pH is too acidic or alkaline than the water becomes inhabitable by aquatic life (desired pH range 6.5-8.0) • Conductivity: effects the buffering capacity of the water • Temperature: influences amount of DO (optimal <20o) • DO: form of oxygen available for aquatic life • Stream Flow: help determine amount of impervious surface area in the watershed • Turbidity: increased turbidity may cause damage to fish gills, suffocating them • Nitrates: can determine amount of fertilizer runoff entering the stream (septic runoff is also a source) • Phosphates: corallites with the amount of soaps and detergents in the water
Profiling a stream • Measure the width of the stream channel • At equal intervals of width (0.5 m) measure stream death • Post a reference point for future depth measurements
Significant Results • Flow • Statistically significant difference (P=.01) in flow from the two sites • Greater stream flow at the upstream site than downstream • Possible reason is the water absorbing quality of the wetland • Rain event prior to data collection and approximately 0.03 cm of precipitation during our survey
Statistical Runner Up • Conductivity • Using a paired T-test we verified a P value of P=0.065 • Almost a significant difference. Desire P<0.05 • What if the study had a longer duration? • Is there an outlier?
Conclusions • We found the wetland does help absorb runoff during rain events • At the time of our study, the area of North Creek we evaluated does comply with Washington State Department of Ecology Standards for a class A stream • Stream quality may change during other seasons