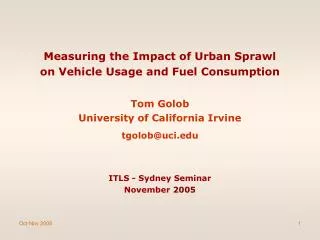
An Analysis of the Impact of Urban Sprawl on Energy Use, the Environment, and the Potential Benefit of Improved Land Use
Julia Marie Ellis Energy Law, Spring 2008 Professor Fred Bosselman, Chicago-Kent College of Law. An Analysis of the Impact of Urban Sprawl on Energy Use, the Environment, and the Potential Benefit of Improved Land Use Planning. Issue.

An Analysis of the Impact of Urban Sprawl on Energy Use, the Environment, and the Potential Benefit of Improved Land Use
E N D
Presentation Transcript
Julia Marie EllisEnergy Law, Spring 2008Professor Fred Bosselman, Chicago-Kent College of Law An Analysis of the Impact of Urban Sprawl on Energy Use, the Environment, and the Potential Benefit of Improved Land Use Planning
Issue • Issue Statement: Urban sprawl is an undesirable land use and development pattern which imposes significant costs on environment, private individuals and businesses, and local, state, and federal government.
Presentation Preview • “Urban sprawl” Defined. • Impacts of Sprawl. • Causes of the Sprawl Trend. • The Perfect Storm for Change. • Possible Solution.
Urban Sprawl Defined Process in which the spread of development across the landscape far outpaces population growth.*1 * 2.
Arial photo of sprawl. Four Components: Low residential density; Little neighborhood mix of homes, jobs, and services; Weak “activity centers” or downtowns; Strict categorical land use and minimal accessibility to the street net work. *2 I. Urban Sprawl Defined: Operationalizing Sprawl
. Most sprawling metros in the Unites States: Least sprawling metros in the Unites States: I. Urban Sprawl Defined: Sprawl Index
. Chicago Metropolitan Area Street Connectivity Score: 134.9 Centeredness Score: 85. 8 Mixed Use Score: 115.1 Density Score: 142. 9 *Centeredness: Concentrations of residential, economic, or commercial activity. These activity centers help businesses thrive and are well served by public transportation. Portland Metropolitan Area Street Connectivity Score: 128 Centeredness Score: 121.8 Mixed Use Score: 102.8 Density Score: 101.3 *2 I. Urban Sprawl Defined: Comparing Cities
I. Urban Sprawl Defined: Template for the Region(Plainfield, I 2008) In the late 1990s, Chicago accounted for only 6% of the land area in its metropolitan region and about 1/3 of the population. *4
Impact of Sprawl: • Auto Dependence • Staggering Statistics: • Americans account for only 5% of the world’s population. • American automobiles produce 45% of the world’s CO2 emissions attributable to the transportation industry. *3
Impact of Sprawl: • Auto Dependence Americans have built themselves out of choices… • Data suggests that car ownership is a necessity for most American families. • Closest corollary to the number of cars owned per house hold? (a) Net income per family (b) Number of working residents per household (c) Sprawlingness of family’s built environment. *1
Impact of Sprawl: Auto Dependence “Communities designed with the car in mind give lower-income families no other alternative. To meet life’s daily needs, to reach jobs, doctors, even to get to the store to buy groceries, most American families, including those who can least afford it, must rely on a car.” *5
II. Impact of Sprawl: Vehicle Miles Traveled (VMT) Understanding the Statistics: 5% Population / 45% CO2 from Autos? • Key Points • Vehicle Miles Traveled (“VMT”) is the average number of mile driven per person per day in a given population. • CO2 emissions correlate exactly with gasoline consumption. • Gasoline consumption and CO2 emissions are nearly perfect corollaries with VMT. *3
II. Impact of Sprawl:Vehicle Miles Traveled (VMT) • VMT increases with sprawl. • VMT ten most sprawling cities: 27 • VMT ten least sprawling cities: 21 • Case study: • Atlanta, GA, VMT 34 • Portland, OR, VMT 24 *3
II.Impact of Sprawl: Forecast U.S. Oil Demand • Energy Consumption for Transportation Continues to Rise Even Though Automobiles Are Increasingly More Efficient.*3 *6
III. Impact of Sprawl: Auto Dependence • #1 Environmental • Damage • Gasoline consumption and CO2 emissions are nearly perfect corollaries with VMT. *3 • CO2 is a GHG.*9 • Permanent ice cover is contracting at a rate of 9% each decade *9
III. Impact of Sprawl: Auto Dependence • #2 Expense to Consumers • 20.3 mpg*8 • 6 add. mi. per day*3 • 365 days • $3.36 per gallon*7 • $362. 48 additional expense per person per year for those persons living in a sprawling environment. • $1450.00 additional expense per year for a family of 4 living in a sprawling environment
III. Impact of Sprawl: Auto Dependence • #3 Dependence on • Foreign Oil • 89% imported from top 10 producers) *10
II. Impact of Sprawl Increased Residential Energy Use Sprawling Development Larger houses 2. Transmission and distribution losses 3. Urban Heat Islands More cooling days Fewer heating days Compact development results in a combined energy savings of 20% of the average US household’s primary energy use.*3
II. Impact of Sprawl Decrease in Permeable Surfaces Increased runoff leads to downstream flooding. Wide fluctuations in water conditions destroy habitats. Greater pollutant loads in the urban environment serve to decrease the effectiveness of natural processing. *11
Illinois Flood Disaster Area 2007 Illinois Severe Storms and Flooding Declared Sept. 25, 2007http://www.fema.gov/news/event.fema?published=1&id=8985
III. Causes of Sprawl Historical background Postwar Federal Policy Encouraged highway development. Inexpensive mortgages for suburban homes.*4
III. Causes of Sprawl Historical background Euclidean Zoning Law Widely separated residential, commercial, and industrial zones Disallowed mixed uses common in older, more established cities Lot size minimums commonly between 1 and 5 acres Strips of “commercial” development zoned to arterial roads
III. Causes of Sprawl Historical background Annexation Laws (Illinois Specific) Req. #1: EPA Approved Waste Water Management Plan Req. #2: Ordinance to annex passed by city (1) Contingent (2) Unincorporated tract of land Req. #3: Majority of landowners sign petition for annexation *12
Causes of Sprawl: Motivators of Sprawl 1. Sales taxes New residents draw new businesses to the area and increase sales tax revenues 2. Deferred cost Development capital stimulates economy immediately 2 or 3 year cost lag. *19 Lack of knowledge of the consequences of current practices 4. Insufficient funding for planning
III. Causes of Sprawl: Percent Change in Pop. by County (2000-2006) * 13
III. Causes of Sprawl: Decision Makers and Stakeholders 1. Land Use Decision Makers Local government policy makers/elected officials Local voters 2. Stakeholders recognized by Illinois Law (a.k.a. Standing) Land owners holding land immediately affected Municipality EPA and those in watershed (Clean Water Act violation) 3. Stakeholders NOT recognized by Illinois Law, i.e. Standing: Neighboring municipalities & regional community State and federal tax payers Environmental groups 4. Challenges INSUFFICIENT at Law (Annexation Specific) Annexation likely leads to additional annexation Annexing municipality cannot/will not provide infrastructure, municipal services, etc., to newly annexed land.*12
Part IV “The Perfect Storm”for Change “Simultaneous occurrence of events which, taken individually, would be far less momentous than the result of their confluence.” *3
IV. “The Perfect Storm” • The Perfect Storm Is Upon Us… • Climate policy • Consumer demand • Urban planning *Ref #4
IV. The Perfect Storm: Changing Policy (2007 - 2008) Trend towards acknowledging the problems with our current energy use practices... Corporate U.S. Climate Action Partnership calls for a 10-30% reduction in CO2 Consumer Pew Int’l Pub. Op. Poll, Environmental degradation as #1 greatest threat 3. Judicial U.S. Supreme Court rules that EPA can regulate GHG emissions *3 4. Congressional Leiberman-Warner Act, 2008 *15 * 9
IV. The Perfect Storm: Consumer Demand • 55% of consumers prefer “Smart Growth Communities” to “Traditional Communities” • Smart Growth Community: Places within a few blocks of home (walkable or drivable), Commute less than 45 minutes, Mix of detached houses and townhouses, Public transportation is nearby, Almost all streets have sidewalks. • Conventional Community: Single family home on large lot, Schools and shops a few miles from home, No sidewalks, Commutes more than 45 minutes, No public transportation. *3
IV. The Perfect Storm: Consumer Demand • Families without children are predicted to account for 88% of the growth in the housing market by 2025 • Under current trends, there will be a 71% shortage of downtown, in-town, and close-in suburban housing by 2025 • Supply of large lot, single family, homes already exceeds demand (as of 2006) *3
IV. The Perfect Storm: Planning • Trends in urban planning profession to acknowledge weakness in current models of development. • Energy consumption, unsupportable at current levels, (AASHTO 2007). *18 • Predict and provide, inefficient and ineffective. *3 • Infrastructure, expensive. *19 • 2. Guinea pig states, such as Oregon, have survived critical judicial challenges and overcome political obstacles. *20
V. Solution Planning Power to the “Common” Sovereign, i.e. the State Land Use Planning Act Essential Components A Comprehensive Statewide Plan Require Local Governments Plans Consistent with the State’s Comprehensive Plan State Level Coordination, Administration, and Review of Local Plans Judicial Review
Solution: Goals for States 1. Statewide Land Use Planning 2. Urbanization Limits 3. Conservation of Energy 4. Transportation 5. Citizen Involvement 6. Agricultural Lands 7. Needed Housing *17
V. Solution: Planning Structure • Land Development Commission • Form • Executive Commission • Appointed by Governor and approved by Senate • Function • Adopts planning goals and implementation rules • Oversees the Department of Land Development Department • Dept. of Land Conservation and Development • Research and plan development • Develops “Policy Papers” to guide implementation • Certifies municipal compliance with state’s master plan *17
V. Solution: Planning Structure • Municipalities/Counties • Create a development plan in compliance with state goals • Implement local plan in compliance with state standards • Judicial Land Use Board of Appeals • Independent administrative adjudicative body where stakeholders can challenge land use decisions. *17
Conclusion Current land use system is inefficient and harmful to the collective good. 2. Statewide planning would promote more efficient energy policies and practices. 3. Market, political, and social changes make “now” the time to act. THANK YOU