Lightning Jump Algorithm
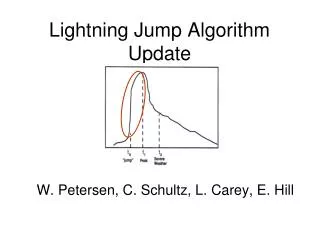
Lightning Jump Algorithm. Current testing and future framework. IC activity increases as a response to the increased collision rate as updraft collapses (lightning trend “jumps”). Updraft loses upward momentum as gravity overcomes buoyancy. Collisions between ice hydrometeors increase.

Lightning Jump Algorithm
E N D
Presentation Transcript
Lightning Jump Algorithm Current testing and future framework
IC activity increases as a response to the increased collision rate as updraft collapses (lightning trend “jumps”) Updraft loses upward momentum as gravity overcomes buoyancy Collisions between ice hydrometeors increase Increased charge separation in mixed phase region Lightning “peak” Severe weather observed at surface several minutes later Schematic lightning history with lightning “jump” and lightning “peak” Adapted from Williams et al. 1999 Thunderstorm updraft develops/strengthens Why Use Total Lightning for Severe Weather Prediction?
Previous Work • Williams et al. (1999) attempted to relate total lightning measurements to predict storm severity in FL thunderstorms. • Goodman et al. 2005 demonstrated that total lightning could be used to analyze severe potential in the Tennessee Valley • Other studies of note: Buechler et al. 2000, Krehbiel et al. 2000, Weins et al. 2005 • Gatlin (2006) laid the framework for the current lightning jump algorithm. • Primarily studied supercell storms in North Alabama • Tested several configurations to determine jumps (1,2 and 5 minutes) • 2 minute configuration yielded highest results (see Gatlin (2006)) • Only one non-severe thunderstorm tested against algorithm • Using this foundation we can expand upon this knowledge to fine tune algorithms • Also we can test severe convection other than just supercell thunderstorms since all severe weather is a threat to life and property
Non-severe thunderstorms • In order to fully understand the concept of lightning associated with severe thunderstorms, non-severe thunderstorms must first be analyzed. • Flash histories of sixty-five non-severe thunderstorms have been analyzed. • August 2002 through September 2007, during the months of May-Sept. • 43 storms from North Alabama, 22 from Houston and Dallas TX (LDAR) • Peak 1 minute flash rates were determined for the dataset. • Average peak flash rate for the entire sample is near 10 flashes min-1* • Averaged time rate of change of the total flash rate (DFRDT) are also determined. • Average DFRDT for the sample was 4.65 flashes min-2 • Peak DFRDT rates were also determined from this dataset • 90% of storms fall below at a DFRDT value of 8 flashes min^2 • 95% of storms fall below at a DFRDT value of 10 flashes min^2 • Importance discussed in future slides * Flashes are thresholded at ≥10 sources (Wiens et al. 2005).
Severe vs Non-severeStill a multifaceted problem • Williams et al. (1999) proposed 60 flashes min-1 or greater for separation between severe and non-severe thunderstorms. • Of 38 studied severe storms in North AL between November 2002 and February 2006, 4 had peak flash rates below 15 flashes min-1 • Difference cannot solely be related to flash thresholding, can it? • (1 vs 10 source) • Additionally, Butts (2006) presented that 29% of cool season tornadic reports in the Southeast (October through March) possessed 0 CG flashes from 1989 to 2002 • What are the odds that there was significant enough IC activity to produce a jump? • Might the best way to make the incorporation of lightning most useful be to collect as many samples as possible and then create probability statistics for storm severity? Adapted from Williams et al. (1999) (above) Taken from Butts (2006) showing the percentage of tornado reports across the Southeast US with 0 CG flashes.
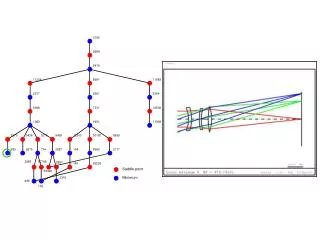
The Game • Motivation: Collecting a large, representative sample of lightning behavior from case studies is time intensive (even if analysis is semi-automated). • Objective: Develop a theoretical framework (“The Game”) in which expected algorithm performance can be assessed in a rigorous statistical manner. • Allow low cost “gaming” or “what if” scenarios to assist algorithm refinement. • Provide for rapid closed-loop feedback between growing lightning data base (aka case studies), algorithm development, and testing. • Approach: Construct statistical simulations based on assumed parametric distributions (e.g., lognormal) for lightning flash parameters (FR and DFRDT) and then run tests on the “virtual” distributions. • Use the Boot-Strap technique, which is a form of Monte Carlo simulation, to pull the flash parameter samples from the assumed population distributions that are defined by a specified mean and standard deviation. • Game is implemented using IDL, taking advantage of built-in statistical and quasi-random number generator packages.
LMA case study data base guides definition of assumed population distributions. Example lognormal distributions of FR and DFRDT for a typical game shown below. In theory, any algorithm from simple to complex can be tested in this fashion. Threshold method (discussed later) has been gamed extensively. POD and FAR as a function of DFRDT threshold for selected FR thresholds are shown below for simulated distributions to left. FR, DFRDT Severe Non-Severe • Boot-strap gaming allows for the exploration of fundamental questions like – “how many case studies is likely enough?” • CSI as a function of sample size (N) shown to right for 10 different samples of underlying FR and DFRDT population distributions. • Small samples cannot be used for assessment! • Law of diminishing returns is evident.
Testing Other Algorithms • 2 Sigma Method • Using 1 minute averaged flash rates over 2 minutes, DFRDT is calculated. • The most recent 10 minutes of DFRDT (not including the observation time) are used to calculate the standard deviation (σ) of the population. • Algorithm does not turn on until the average flash rate for a storm reaches 10 flashes min-1 (based on non-severe data). • A jump occurs when DFRDT values increase beyond the jump threshold of 2σ • Jumps that occur within 6 minutes of each other are counted as 1 jump • A jump ends when the DFRDT value drops below 0. • 3 Sigma Method • Same concept but the jump threshold is now 3σ • Threshold method • Using information from the dataset of non-severe thunderstorms two thresholds are used to determine storm severity. • First, the storm must reach the flash rate criteria of 10 flashes min-1 • Second DFRDT values must reach a chosen threshold. • Using the 90th and 95th from the non-severe dataset, DFRDT thresholds are set at 8 and 10 flashes min-2, respectively. • This algorithm is more objective
Algorithm Differences • Gatlin • Highly sensitive to small changes in total flash rate. • Increases the chance at detection (POD), but also increases the false alarm rate (FAR) • Data smoothing • Total lightning data very noisy, this algorithm takes this into account. • Shorter sample periods, less lightning data needed to analyze potential jumps. • 2 Sigma and 3 Sigma • Accounts for typical behavior in non-severe lightning activity. • 10 flash min-1 minimum to turn on • Longer sample period needed, however, a larger flash and DFRDT history used in calculations. • Higher magnitude DFRDT threshold reduces FAR • Threshold • Based on past observations of non-severe thunderstorm activity • Simple yes/no storm severity criteria required
Severe only All storms Preliminary Results *Gatlin 45 refers to the Gatlin algorithm with a warning length of 45 minutes. • Non-severe thunderstorms • (43 North Alabama cases) • Severe Thunderstorms (35 cases, 102 reports, <100 km) Severe only All storms Severe only All storms
Preliminary Results (c’td) • Severe Thunderstorms (<150 km, 38 cases, 128 reports) Severe Only All Storms Severe Only All Storms Severe Only All Storms
Lead Times and NWS Performance Adapted from NWS (http://www.weather.gov/cfo/program_planning/doc/All_GPRA2006.pdf)
Null Case Example • June 19, 2007 • EF0 tornado in Trinity, AL • Little if any lightning activity in area of interest 1 hr before or after tornado (~1605 Z). • Shows that lightning data can be a useful tool, but it will not work all of the time. LMA Source Data 15 -17Z 19 June 2007 Base reflectivity KGWX 1557 UTC
Future Work • Increase the number of thunderstorms variety of thunderstorm types and locations • Currently using data from the North Alabama and DC LMA’s • Interface algorithm with jump parameters modified to accommodate GLM-proxy dataset • Continued “gaming” modification based on cases • Incorporating other satellite-derived products for comparisons to total lightning (IR brightness temperature, radiometer measurements) • Currently using radar derived products in analysis. • Lightning modeling of storms • COMMAS model (Ted Mansell) or other (e.g., U. Leeds), WRF w/o lightning but solid convective proxy • Interface to Bob Boldi’s cell tracking work • Fundamental to trending/tracking lightning-producing cells, and computing potential jumps