Download
1 / 66
660 likes | 851 Views
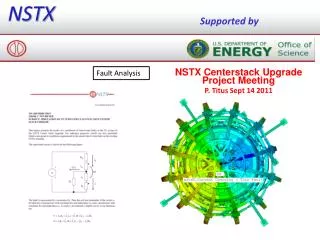
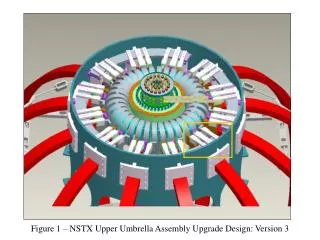
Figure 1 – NSTX Upper Umbrella Assembly Upgrade Design: Version 3. 304 SS Support. G10 Support. Figure 2 – Single Segment Strap Assembly Version 3 with G10/ 304 SS Supports. Figure 3 – Single Segment Strap Assembly: Center Strap Only. R out = 5.688”. 38 Laminations: - .060” thk; .005” gap

E N D
Figure 1 – NSTX Upper Umbrella Assembly Upgrade Design: Version 3
304 SS Support G10 Support Figure 2 – Single Segment Strap Assembly Version 3 with G10/ 304 SS Supports
Rout = 5.688” 38 Laminations: - .060” thk; .005” gap Mat’l: Copper Wtfull = 37.4 lb (Wtarch = 20.4 lb) Rin = 3.160” 7.5” Bpol= .3 T 5” I = 130 kA Uvertthermal = .3 in Btor = 1 T Uradthermal = .018 in 2.523” 2” Figure 4 – Single Laminated Strap Assembly with Applied Fields and Current
Calculated EMAG Loads Fop Out-of-Plane Load (z-direction) I+ R Fop = 2*I*Bpol*R Fop = 2 x 130,000 A/ 38 x .3 T x 5.688/39.37 m Fop = 296.4 N = 66.6 lbf [per lamination] Bpol In-Plane Load (y-direction) pressip Fip/ L = I*Btor Fip/ L = 130,000 A/ 38 x 1 T [per lamination] Fip/ L = 3,421 N/ m x .2248 lbf/ N x 1 m/ 39.37 in Fip/ L = 19.53 lbf/ in pressip = (Fip/ L)/ w pressip = 19.53 lbf/in / 2 in pressip = 9.77 lbf/ in2 (applied to inside cylindrical faces) x x x x x x x x x x x x x x x x x x I+ w Btor
Force = 66.6 lbf Ux = .018 in Uy = .3 in Uz = 0 Press = 9.7 psi Fixed 3 Elements thru Thickness Figure 5A – Single Lamination FEA Model: Mesh and Boundary Conditions
Figure 5B – Single Lamination Linear Results: von Mises Stress Loads: Combined Thermal Displacements, Emag Press. (In Plane) and Forces (OOP)
Figure 5C – Single Lamination Linear Results: von Mises Stress Loads: Thermal Displacements Only
Figure 5D – Single Lamination Linear Results: von Mises Stress Loads: In-Plane (Pressure) Load Only
Figure 5E – Single Lamination Linear Results: von Mises Stress Loads: Out-of-Plane (Force) Load Only
Large deflection = On Figure 5F – Single Lamination Nonlinear Results: von Mises Stress Loads: Combined Thermal Displacements, Emag Press. (In Plane) and Forces (OOP)
Baseline-Design MathCAD Flex Strap Lamination Analysis: Conclusions/ Recommendations • ~3/4 overall stiffness due to Inner Strap Assy • OOP torsional stress dominates in Outer Strap Assy; thermal displacement bending dominates in Inner Strap Assy • OOP force proportional to radius • Thermal displacement bending stress inversely proportional to radius • Deflection force inversely proportional to radius • Proposed Design: • Outer Assy: 12X .090” thick, 2.0” wide laminations • Inner Assy: 19X .060” thick, 2.0” wide laminations • Mat’l: Fully-hardened Cu-Zr
Baseline Design Proposed Design ASM International, “Atlas of Stress-Strain Curves”, Electrolytic Tough-Pitch Copper (C11000) Figure 5G – Copper Stress-Strain Curves versus % Cold Work Baseline Design and Proposed Design Combined-Load Stresses Shown
Baseline Design Proposed Design NIST Monograph 177, “Properties of Copper and Copper Alloys at Cryogenic Temperatures” Figure 5H – Copper Fatigue S-N Curves versus % Cold Work Baseline Design and Proposed Design Combined-Load Stresses Shown
Large deflection = On Figure 5J – Single Lamination Nonlinear Results: Z-Deformations Loads: Combined Thermal Displacements, Emag Press. (In Plane) and Forces (OOP)
Large deflection = On Figure 5K – Single Lamination Nonlinear Results: Z-Deformations_Front Loads: Combined Thermal Displacements, Emag Press. (In Plane) and Forces (OOP)
σhoop = P*R/ t = 9.77 psi x 5.688 in/ .060 in = 924 psi Large deflection = On Figure 5L – Single Lamination Nonlinear Results: von Mises Stress Loads: Emag Pressure (In Plane) Only
1st Mode Load Multiplier = 58.4 1st Mode Load Multiplier = 58.4 3rd Mode Load Multiplier = 117.6 (Nonlinear 1st Mode Load Multiplier = 50) Large deflection = Off 2nd Mode Load Multiplier = 73.0 Figure 5M – Single Lamination Pre-Stressed Linear Buckling Results Load multiplier LMF applies to all Emag loads and thermal displacements
Y LMF = 14 0 80 Large deflection = On Figure 5N – Single Lamination Nonlinear Buckling: Y-Deformation at Onset (1) Load multiplier factor LMF applies only Out-of-Plane Emag load
Y LMF = 26 0 80 Large deflection = On Figure 5P – Single Lamination Nonlinear Buckling: Y-Deformation at Onset (2) Load multiplier factor LMF applies only to Out-of-Plane Emag load
Conclusions • Buckling due mostly to out-of-plane load. In-plane load (pressure outward) reduces buckling; thermal displacements slightly increase buckling. • Good agreement between linear and nonlinear buckling results with load multiplier factor applied to both Emag loads and to thermal displacements. • Load multiplier factor over 14 for nonlinear analysis with constant in-plane load and increasing out-of-plane load (conservative).
3 Elements / Lamination Figure 6A – 3 Lamination FEA Model: Mesh
Large deflection = On Frictional contact (COF = .4) Figure 6B – 3 Lamination Nonlinear Results: von Mises Stress Loads: Combined Thermal Displacements, Emag Press. (In Plane) and Forces (OOP)
Large deflection = On Frictional contact (COF = .4) Figure 6C – 3 Lamination Nonlinear Results: Z-Deformations Loads: Combined Thermal Displacements, Emag Press. (In Plane) and Forces (OOP)
Large deflection = On Frictional contact (COF = .4) Figure 6D – 3 Lamination Nonlinear Results: Z-Deformations_Front Loads: Combined Thermal Displacements, Emag Press. (In Plane) and Forces (OOP)
Large deflection = On Frictional contact (COF = .4) Figure 6E – 3 Lamination Nonlinear Results: Contact Status Loads: Combined Thermal Displacements, Emag Press. (In Plane) and Forces (OOP)
3rd Mode Load Multiplier = 61.8 1st Mode Load Multiplier = 58.2 Large deflection = Off Frictional contact (COF = .4) 2nd Mode Load Multiplier = 60.7 Figure 6F – 3 Lamination Results: Linear Buckling Mode Multiplier Load Multiplier factor LMF applies to all Emag loads and thermal displacements
Figure 7A – Single Laminated Strap Assembly FEA Model: Bonded and Frictionless Contact Areas
3 elements/ lamination # Nodes = 850423 # Elements = 152895 Figure 7B – Single Laminated Strap Assembly FEA Model: Mesh
Large deflection = Off Frictional contact (COF = 0) Fig. 7C –Laminated Strap Assembly FEA Results - Thermal Displacements Only: von Mises Stress
Large deflection = Off Frictional contact (COF = 0) Fig. 7D –Laminated Strap Assembly FEA Results – Thermal Displacements Only: Total Deformation
By = .3T Bz = 1 T ux = .018” uy = .30” I = 130 kA JS FLorentz Non-Linear Large Deflection Non-Linear Large Deflection Heat Gen Tnodes Fig. 8A – Upper Flex Strap ANSYS Multiphysics Analysis Work Flow Diagram
Fig. 8C – Single Segment_Center Strap Assembly: von Mises Stress_Iso-View
Fig. 8D – Single Segment_Center Strap Assembly: von Mises Stress_Side View
Figure 8E – Single Segment_Center Strap Assembly: Joint Contact Pressure
Figure 8F – Single Segment_Center Strap Assembly: Thread Stress
Figure 9B – Strap-to-E Beam Joint Analysis: Full-Load von Mises Stress
Full-Load Pretension Figure 9C– Strap-to-E Beam Joint Analysis: Maximum Shear Stress
Full Load Pressure Bolt Pretension-Only Pressure Figure 9D – Strap-to-E Beam Joint Analysis: Contact Pressure
Full Load Status Bolt Pretension-Only Status Figure 9E – Strap-to-E Beam Joint Analysis: Contact Status
Figure 10B – Strap-to-TF Coil Outer Leg Joint Analysis: Full-Load Stress
Full Load Pressure Bolt Pretension-Only Pressure Figure 10C – Strap-to-TF Coil Outer Leg Joint Analysis: Contact Pressure
Full Load Pressure Bolt Pretension-Only Pressure Fig. 10D – Strap-to-TF Coil Outer Leg Joint: TF Leg-Only Contact Pressure
Full Load Status Bolt Pretension-Only Status Figure 10E – Strap-to-TF Coil Outer Leg Joint Analysis: Contact Status
0 V 130,000 A Fig. 11A – Single Segment_Center Strap Electric Model: Boundary Conditions
Figure 11B – Single Segment_Center Strap Electric Model Results: Voltage