Download
1 / 19
190 likes | 340 Views
A Comparison of Spectral Fit Results of E0102 from the Chandra and XMM CCDs Paul Plucinsky & Joseph DePasquale. Other Contributors to this Effort. CXC: R. Edgar , N. Schulz, A. Vikhilin MIT: K. Flanagan, D. Dewey, lots of help from MIT ACIS team.

E N D
A Comparison of Spectral Fit Results of E0102 from the Chandra and XMM CCDs Paul Plucinsky & Joseph DePasquale
Other Contributors to this Effort CXC: R. Edgar , N. Schulz, A. Vikhilin MIT: K. Flanagan, D. Dewey, lots of help from MIT ACIS team
Why Use E0102 as a Calibration Source for the CCDs? • Well-characterized spectrum, both the Chandra HETG and XMM RGS have observed the object • The spectrum is relatively simple by astrophysical standards, no or very little Fe, strong lines of O, Ne, and Mg • Extended source so pileup effects are minimized • Constant source • The O and Ne lines sample an energy range in which the on-board calibration source does not have strong lines • Low-energy part of the bandpass is always a challenge to calibrate
Spectral Model: Calibration vs. Astrophysics • Primary Objectives are to measure the gain, the spectral redistribution function, and detection efficiency in the 0.5 -2.0 keV range • Our immediate concern is to develop a model useful for calibration, not to develop an astrophysically-meaningful model, • We use a model consisting of 24 Gaussians for the lines identified by the HETG and RGS, a bremsstrahlung for the continuum, and a two component absorption (Galactic and SMC) • Line energies are fixed at the true values and the widths of the Gaussians are fixed at zero, so the only parameter which varies is the normalization • Constrain the ratio of the OVII For (561 eV)/O VII Res (574 eV) to 0.58 based on HETG and OVII (665 eV)/ OVIII Ly-alpha (654 eV) to 0.1368 (ratios from Flanagan et al. 2004)
ACIS-Specific Calibration Issues: • CTI Correction for the FI CCDs • Time-dependent gain correction for both BI and FI CCDs • QE correction for the S3 CCD (summer 2004) • Time-dependent and spatial-dependent correction for the contamination (aka ``The Marshall Layer’’) • We used CIAO 3.2 and CALDB 3.0.0 (released Dec 2004) Chandra Data: • 44 observations on I3 and 20 observations on S3, roughly once every 6 months • Data (spectra, rmfs, & arfs) available at: “http:cxc.harvard.edu/acis/E0102/splash.html” Available for any one to download, please do if you would like the data !! XMM Data: • Provided by Andy Read (16 MOS1/MOS2) and Michael Smith (1 each MOS1/MOS2/PN)
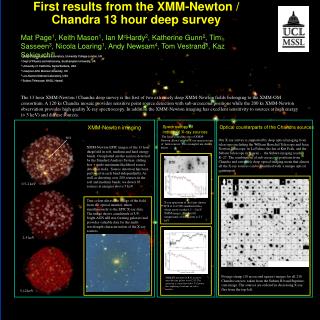
Gratuitous Pretty Pictures of E0102 S3 Summed Data ~100 ks True Color Image
S3(BI) Ne X Ly-a Mg XI triplet OVIII Ly-a Ne IX triplet OVII triplet
I3(FI) OVIII Ly-a OVII triplet Mg XI Ly-a Ne IX triplet Ne X Ly-a
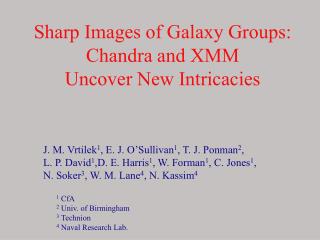
Thick filter Large Window MOS 1 MOS 2
Thick Filter Large Window MOS 1 MOS 2
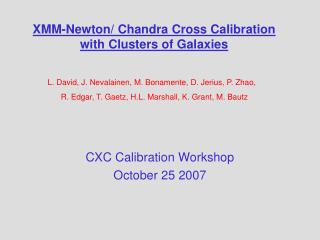
Thick Filter Small Window PN MOS 1 MOS 2
PN Thick Filter Small Window
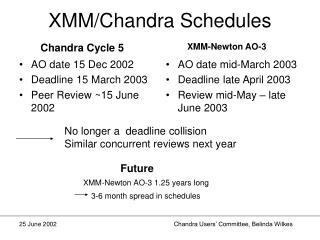
Mkn 421 Obsid 4148: row 178 Obsid 5332: row 512 Schulz (MIT) 12.35 A (1004 eV) 15.54 A ( 798 eV) 18.71 A ( 662 eV) 21.12 A ( 587 eV) 23.48 A ( 528 eV) 25.09 A ( 494 eV)
Schulz (MIT) 1004 eV 662 eV 587 eV 494 eV
Conclusions and Future Work • ACIS BI and FI CCD results are more consistent than earlier, but discrepancies still exist • ACIS results appear to be more consistent with the PN results • We need to fit the rest of the XMM data • We need to understand and constrain the relative contribution of the lines and the continuum • We need to improve the BI spectral redistribution function • We need to understand the apparently “discrepant” data sets for ACIS