Download
1 / 43
430 likes | 454 Views
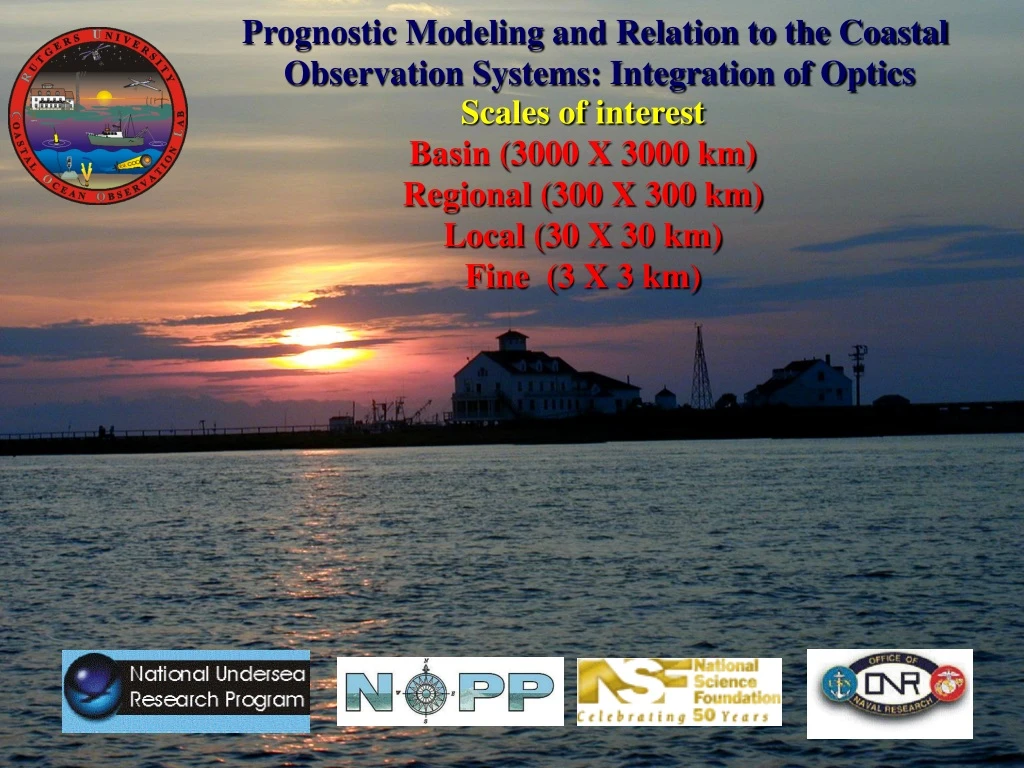
This study focuses on the integration of optics scales in prognostic modeling and coastal observation systems to provide rapid environmental assessment during crises such as pollution spills, harmful algal blooms, and storms.

E N D
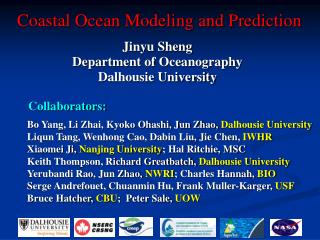
Prognostic Modeling and Relation to the Coastal Observation Systems: Integration of Optics Scales of interest Basin (3000 X 3000 km) Regional (300 X 300 km) Local (30 X 30 km) Fine (3 X 3 km)
The Applied Problem: Rapid Environmental Assessment Need data (with uncertainties) now As the Crisis approaches the Nowcast becomes the most important data source, also the time and space scales begin to collapse Forecasts Importance Climatology Nowcast Time Crisis Crises: Pollution spills, HABs, storms
No CTD data CTD data Regional MODAS
Regional Ocean Modeling System (ROMS) Development Initiated by Rutgers/UCLA 1997 Features: • Free-surface, hydrostatic, primitive equation model • State-of-the-art turbulence closure schemes for atmosphere and ocean • Efficient coarse-grained, shared-memory, parallel code • Enables support of high-resolution real-time coastal forecasting applications
Navy Products Rutgers Global Atmospheric Forecasts NOGAPS 1998 I.C. B.C. Local Atmospheric Forecasts NORAPS Atm. Forcing Ocean Models ROMS SBL
Navy Products NOAA & Rutgers Global Atmospheric Forecasts NOGAPS NCEP 1999 I.C. B.C. I.C. B.C. Local Atmospheric Forecasts COAMPS 27 km 6 hours RAMS 4 km 30 min Atm. Forcing Atm. Forcing Ocean Models ROMS PBL SBL BBL WBL MODAS (POM) I.C. B.C. & 2000 Waves WAM Wave Models
Ship/AUV Data Ship/AUV Data Ship/AUV Data Ship/AUV Data Ship/AUV Data Ship/AUV Data Ship/AUV Data Forecast Day 4 Day 1 Forecast Day 2 Forecast Day 3 D4 Day 1 Forecast Day 2 Forecast Day 3 Rmt / Node Remote Sensing / Node Data Remote Sensing / Node Data Model Run Model Run Nwcst Day 0 Day -2 Day -1 Nwcst Day 0 Assim Day -3 Day -2 Day -1 A Typical Forecast Cycle Day 1 Forecast Day 2 Forecast Day 3 Remote Sensing / Node Data Remote Sensing / Node Data Model Run Day -2 Day -1 Nwcst Day 0 Assim Day -3 Day -2 Day -1 11 12 13 14 15 16 17 18 19 20 21 22 23 24
Real-time Thermistors ROMS/COAMPS ROMS/RAMS MODAS COAMPS
Real-time Thermistors ROMS/COAMPS ROMS/RAMS MODAS COAMPS
STORM OBS RAMS COAMPS NOGAPS
ROMS/COAMPS MODAS/COAMPS latest Hernan stuff.... REMUS ROMS/RAMS
WHERE DO WE GO? Terrain-following Ocean Modeling System (TOMS) lTOMS development (Rutgers & Princeton) lCoupling to COAMPS (CBLAST) lBoundary Layers (CBLAST, Rutgers) lTwo-way Nesting (UCLA, NOAA Forecast Systems Lab) lCoastal/Basin Interactions (NRL MODAS team, Rutgers) lParallel Performance for Scalibility (UCLA, JPL, FSL, Rutgers) l3-D Visualization (Old Dominion) lModel Evaluation and Metrics (Rutgers, Miami) lTides (Rutgers, U. Conn, USGS) lRivers (USGS) lLagragian Drifters (Old Dominion) l OPTICS AND BIOLOGY (FERI) -More to come ……..
Data Assimilation (and players) Arthur Miller / Bruce Cornuelle (SIO) Green Functions Inverse Scheme Adjoint Model Andrew Moore (U. Colorado) Tangent Linear and Adjoint Models Kalman Smoothing Ensemble Forecasting with Singular Vectors and Stochastic Optimals Andrew Bennett (FNMOC/OSU) Inverse Ocean Modeling (IOMS) Physical-Space Statistical Analysis System (PSAS) Pierre Lermusiaux (Harvard) Error Subspace Statistical Estimation (ESSE) Hernan Arango (Rutgers) Tangent Linear and Adjoint Models ESSE Parallelization
NorthEast Ocean Observing System (NEOOS) Participating Institutions • State of Maine, Maine • Bigelow Laboratory for Ocean Sciences, Maine • University of Maine, Maine • Dartmouth College, New Hampshire • University of New Hampshire, New Hampshire • Woods Hole Oceanographic Institution, Massachusetts • Martha's Vineyard Observatory, Massachusetts • University of Rhode Island, Rhode Island • University of Connecticut, Connecticut • SUNY, Stony Brook, New York • Rutgers University, New Jersey • NOAA • University of Maryland, Maryland • University of Delaware, Delaware • VIMS, University of William & Mary, Virginia • Old Dominion University, Virginia • Duck, North Carolina
NEOOS HF-Radar Backbone Existing Systems (6) Funded Systems (8)
EcoSim 2.0 Model Formulation Air/Sea CO2 Dust Physical Mixing and Advection Light N2 Iron CO2 NH4 NO3 PO4 SiO4 Relict DOM Cocco-litho-phores Benthic Flora Pelagic Diatoms Dino- flagellate Tricho-desmium Synecho- coccus G. breve Excreted DOM Lysed DOM Hetero- Flagellet Viruses Copepod Ciliates Bacteria Sediment Detritus Predator Closure
Light Propagation based on IOPs For each depth interval light attenuation c(l,t) = a(l,t) + b(l,t) absorption a(l,t) = awater(l) + aphyto(l) + aCDOM(l) + ased(l) scattering b(l,t) = bwater(l) + bphyto(l) + bCDOM(l) + bsed(l) backscattering bb(l,t) = bb,water(l) + bb,phyto(l) + bb,CDOM(l) + bb,sed(l) geometric structure of light md(l) = fxn[b(l,t),c(l ,t), m0(l)] diffuse light attenuation Kd(l) = [a(l,t) + bb(l ,t)]/md(l)]
1.0 0.0 1.4 1 Absorption-555 Depth (m) 0.6 1.5 0.2 Distance (km) 0 10 Kd (predicted) After Storm (lots nonalgal particles) Upwelling 443 nm 0 Kd (measured) 0 1.5 1.4 Slope of measured & predicted Kd 1 0.6 0.2 443 510 620 443 510 620 412 490 555 670 412 490 555 670 Wavelength (nm) Wavelength (nm) 1 1 0.6 0.6 R2 0.2 0.2 443 510 620 443 510 620 412 490 555 670 412 490 555 670 Wavelength (nm) Wavelength (nm) AC-9 & Default VSF settings
Red Peak normalized absorption Wavlength (nm) Estimated Phytoplankton Absorption Spectra from AC-9 data pink -modeledblue - measured 0.8 The Good The Bad 0.6 Inverse meters R2 0.4 0.2 Wavlength (nm) 0 400 450 500 550 600 650 700 Wavelength (nm) In-water IOP inversions (from ac-9) 1.5 at depth 1.1 Correlation slope between measured and predicted phytoplankton absorption 0.7 all 0.3 (n = 68) surface -0.1 400 450 500 550 600 650 700 Wavelength (nm)
Ocean Color Products Remote sensing reflectance at wavelength 412, 443, 490, 510, 555 and 670 nm Diffuse attenuation coefficient at 532 nm by Mueller Surface albedo measured at 865 nm Chlorophyll a concentration by Rick Stumpf Absorption at wavelength 412 nm due to dissolved organics Absorption at wavelength 443 nm due to phytoplankton Absorption at wavelength 412, 443, 490, 510, 555 and 670 nm by Robert Arnone Backscatter at 443 and 555 nm by Robert Arnone Chlorophyll a concentration by Kendall Carder Absorption at wavelength 412, 443, 490, 510, 555 and 670 nm by Kendall Carder Absorption at wavelength 412 nm due to dissolved organics by Kendall Carder Absorption at wavelength 443 nm due to phytoplankton by Kendall Carder Backscatter at 443 and 555 nm by Kendall Carder Attenuation at 670 nm by Kendall Carder SeaDas Products Upwelling/Nonwelling radiance at 670 and 865 nm Chlorophyll a concentration Coastal Zone Color Scanner Diffuse attenuation at 490 nm Water leaving radiance at 412, 443, 490 510 and 555 nm Normalized difference vegetation index Optical Depth at 865 nm
e n s o r s v a n c e d S p a c e c r a f t a n d S X - b a n d A c c e s s i b l e A d a t e L o c a l T i m e K m ) R e s . ( K m ) L a u n c h D ( m b p s ) R e s . ( - 1 C h i n a H Y : 3 0 A M 1 . 0 2 0 0 0 2 d a y s / 8 5 . 4 4 . 0 C O C T S 1 0 d a y s / 8 : 3 0 A M 0 . 2 5 6 4 . 0 C Z I 4 O P L M u s t b e t u r n e d 0 . 5 5 I n d i a 5 . 2 I R S - P 3 o n f o r r e c e p t i o n 1 3 M O S I R S - P 4 ( O c e a n s a t 1 ) I n d i a 2 d a y s / 1 2 : 0 0 P M 0 . 3 6 L a u n c h e d 8 1 0 . 4 1 . 8 O C M 1 9 9 9 2 d a y s / 1 0 : 3 0 A M M 1 U S A 1 3 E O S A M 1 / P . 2 5 0 . 2 5 0 M O D I S 2 y s / 1 : 3 0 P M 0 . 5 2 0 0 0 2 d a 0 . 5 M O D I S 5 1 . 0 1 . 0 M O D I S 2 9 2 0 0 0 2 d a y s / 1 0 : 4 5 A M J a p a n 6 A D E O S - 2 1 . 0 0 . 2 5 6 G L I 1 . 0 1 . 0 G L I 3 0 Rutgers, SeaSpace Inc., NRL, FERI, OSU, Satlantic, UCSB, NASA 0 0 1 2 . 5 d a y s / 1 0 : 3 0 A M 2 U S A 1 5 0 N E M O n / a 0 . 0 3 - 0 . 0 6 2 4 0 C O I S 0 . 0 5 1 C O I S 8 m o n t h s ) ( S a t e l l i t e L a u n c h e s w i t h i n 1
Calibration of Remote Sensing Products 0.02 0.5 a550 1.0 0.0 39o50 July 16, 1999 Ship Transects Depth (m) Absorption-555 39o30 0 10 Distance (km) 74o00 74o30
In-water data & Hydrolight & Remote Sensing Estimated from insitu data Satellite measured 510 nm 5 0 Dist (km) Dist (km) 10 0 SeaWiFs Reflectance Non-biotic particles Hydrolight Reflectance 0.01 Onshore Midshore Offshore Remote Sensing Reflectance 0.005 0 412 490 555 412 490 555 412 490 555 443 510 670 443 510 670 443 510 670 Wavelength (nm)
PHYLLS Overflight 8500’ Field Station • Hyperspectral Sensor • 1.5 meter resolution
Spectra: Red Tide vs. Blue Water Raw Counts July 22 Red Tide: Run 10 Sequence 6 650 nm band of calibrated data
Larger Grid Patterns BL Isosurfaces 1E10 ph/s/35L 0 3E11 ph/s/.35L Depth (m) 15 Latitude (~5km) Longitude (~2km)
REMUS Bioluminescence Pattern BL Isosurfaces 5E10ph/s/.35L 1E11ph/s/.35L Depth (m) Latitude (~300m) Longitude (~500m)
Technical Achievements 5,280 CTD casts, 45 min delay data, held position through a storm, controlled from both NJ OR Massachusetts.
Temperature Cross Section - July 19, 2000 Economics -Big ship is at on order of 10K/day -Glider is around 100K Glider/Shipboard CTD Comparison - July 21, 2000 R/V Endeavor Temperature Cross Section - July 27, 2000
Conclusions l Nowcast and forecast models have shown improvement in turbulent coastal waters real-time data streams, assimilation the key, & nested grids l Development of bio-optical models to be coupled to the nowcast/forecast models models grounded in the IOPs can utilize the new suite of algorithms that show promise l The new coupled observation/model systems will hopefully fill the critical void in the 30 to 300 km spatial scale
2000 HyCODE/COMOP Partners Dan Fox Wesley Goode Rick Gould Don Johnson Mark Hulbert Dan Kennedy Sherwin Ladner Gia Lamela Jerry Miller Steve Payne Joe Rhea Bob Rhodes Robert Stavn Alan Wiedeman Office of Naval Research Steve Ackleson Joan Cleveland Oregon State Francois Baratange Scott Pegau Emmanuel Boss Mike Twardowski Planning Systems Inc. Todd Bowers Jeffery Jones Laurie Jugan Walter McBride Prariestarfish Filming Randy Oslon Peter Lo Greco Sienna McClean RD Instruments Joel Young Scripps Ken Melville Dariusz Stramski Ronan Gray Lisa Lelli Peter Matusov Michael Ritter Eric Terrill Charlie Belmonte Rob Sharry Phoebe Zang Richard Lathrop Janice McDonnell Mike DeLuca Tanya Podchaski Eric Simms Bob Rossi Marge Podchinski Bosch Aerospace Inc. Jim Boschma Judy Boschma Mike Ryder Cal. PolyTech State U. Mark Moline Erika Heine Matt Oliver Dwight Peterson Cristina Orrico CODAR Ocean Systems Don Barrick Pete Lilleboe Belinda Lipa Laura Pederson Cornell University William Philpot Minsu Kim Dave Kohler Bruce Monger Dalhousie University Alex Hay Todd Mudge Wes Paul Bruce Johnson Xiaodong Zhang ExxonMobile Dick Lassard Wolfgang Konke Florida Env. Res. Inst. Paul Bissett Grace Chang HOBI Labs Robert Maffione Paul Coenen Lamont Doherty Robert Vallincourt John Marra MetOcean Nick Van Stight MBARI Steven Haddock Mote Marine Lab Gary Kirkpatrick National Weather Service James Eberwine Naval Air Warfare Ctr. David Allocca Tom Curran Brian Concannon Mike Contarino Linda Mullen Naval Oceanographic Office Annetta Vitale Naval Research Lab Washington D.C. Jeff Bowles Curt Davis Eric Hartwig Mary Kappus William Snyder Mike Sydor Stennis Robert Arnone Jeff Book Satlantic Marlon Lewis Scott McLean Cyril Dempsey Geoff MacIntyre Sequoia Scientific Yogi Agrawal Doug Keir U. S. Naval Reserve LCDR Kimberly Lunde CDR Ted Mahoney Chris Bryant James Cook Kevin Brockway Chris Harbord Ron Naumowicz Ramon Rodriegez Joel Valdez Univ. of California S. B. Tommy Dicky James Case Amanda Briggs Christy Herren Kirk Ireson Dereck Manov David Sigurdson Raymond Smith Frank Spada Univ. of Rhode Island Crew of the Endeavor Univ. of Portugal Nuno Cruz Univ. of S. Mississippi Germana Peggion Webb Research Doug Webb Clayton Jones WHOI Tom Austin Anthony Berry Tom Fulton Tim Prestero Mike Purcell Roger Stokey Dave Fratantoni Deb Glickson Janet Fredericks John Trowbridge Ship Crews Jim Hughes Mike Danko Adam, Mike John Keller Seatow Joe Seatow Gregg Rutgers University J. Frederick Grassle Scott Glenn Kristie Andresen Louis Bowers Rob Cermak Bob Chant Liz Creed Mike Crowley John Fracassi Josh Kohut Sage Lichtenwalner Rich Styles Hank Statscewich Oscar Schofield Meredith Armstrong Trish Bergmann Jon Senchisen Felisa Wolf Dale Haidvogel Hernan Arango Kate Hedstrom Roni Avissar Richard Dunk Hai Pan Luke Oman Kenneth Able Melissa Neuman Judy Grassle Roger Hoden Paul Jibov Bill Packer Bill Tonkin Angie Podlinski Sharron Smith Bobbie Zlotnik Rose Petrecca Dave Andrews Joe Dobarro Joe Lesnieski Jack Keith Rodney Pendry Ron Van Sant John Zlotnik John Wiggins 190 people 32 Institutions 13 ships, 2 planes, 2 AUVs