Download
1 / 20
200 likes | 333 Views
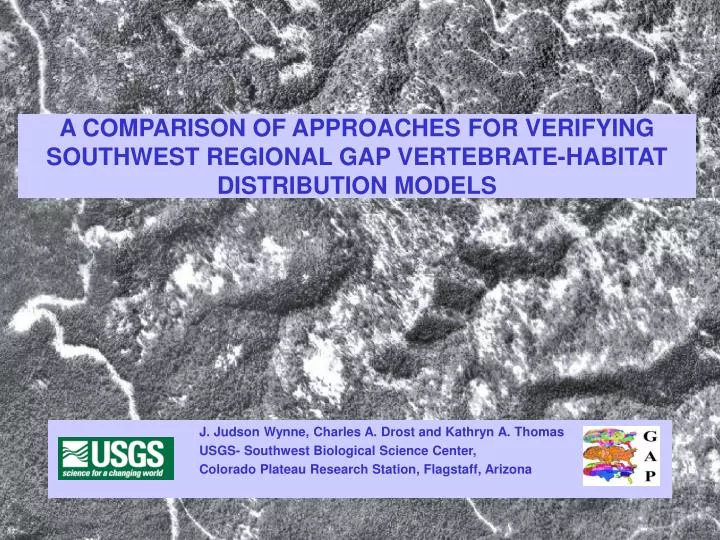
A COMPARISON OF APPROACHES FOR VERIFYING SOUTHWEST REGIONAL GAP VERTEBRATE-HABITAT DISTRIBUTION MODELS. J. Judson Wynne, Charles A. Drost and Kathryn A. Thomas USGS- Southwest Biological Science Center, Colorado Plateau Research Station, Flagstaff, Arizona. Southwest Regional Gap.

E N D
A COMPARISON OF APPROACHES FOR VERIFYING SOUTHWEST REGIONAL GAP VERTEBRATE-HABITAT DISTRIBUTION MODELS J. Judson Wynne, Charles A. Drost and Kathryn A. Thomas USGS- Southwest Biological Science Center, Colorado Plateau Research Station, Flagstaff, Arizona
Southwest Regional Gap • AZ, CO, NM, NV, UT • Data products: land cover, stewardship and wildlife-habitat maps • 833 wildlife habitat maps - Habitat correlates identified via literature reviews • Information to land managers, researchers, policy makers, and the general public
Objectives • Review approach to accuracy assessment used in previous GAP programs. • Describe an alternative approach to GAP accuracy assessment. • Compare and contrast the two approaches. • Identify best approach.
Accuracy Assessment • Agreement between the expected and observed • Utility: - Evaluate model quality - Identify and correct for error - Compare techniques, algorithms, and model developers - Assess relevance in decision making
Without Accuracy Assessment… ? + = Does ? = And does Models are untested hypotheses
Gap and “Accuracy Assessment” Species list approach - compiled list of species within given management areas - overlaid on predictive distribution maps - “measure of agreement” with omission and commission errors
Taxonomic Group No. of Areas Amphibians 10 Reptiles 10 Birds 15 Mammals 10 From Drost et al. (1999) Sample Size Arizona Accuracy Assessment GAP1 - Source data: USDA FS, NPS, AGFD, TNC - Criteria 1. Intensive, area wide for ≥ one taxon 2. Compilation of several surveys with ≥ one taxon 3. Compilation of secondary sources
Expansion Contraction Range Issues Require recent data to assess these issues
False Agreement Incidental/ accidental occurrences
False Agreement Observations not within habitat
Issues of Temporal Scale Time frame reflected in data
Taxonomic Group No. of Areas R2 P-value Amphibians 10 0.483 0.026 Reptiles 10 0.339 0.077 Birds 15 0.787 <0.01 Mammals 10 0.567 0.012 Birds Issues of Spatial Scale Arizona Accuracy Assessment GAP 1 • For all groups, model accuracy <50% for areas <1000ha • Accuracy increased as species list area increased
A Higher Standard • Approach: Use of species occurrence data • Measure of habitat rather than indirect measure of range • More appropriate scale • Statistically meaningful accuracy metrics
Data Sources for Model Verification - Presence only point data - Presence/ absence point data - Grid-based data
Presence Only Data USDA Forest Service Arizona / New Mexico database - Point data - Museum specimen, trapping and other observations - Standardized format
Presence/ Absence Data AGFD Bat Data (Central Arizona) - Point data - Systematic sampling protocols - Seven year dataset - Multiple surveys/ year/ site
Grid Data Arizona Breeding Bird Atlas - Appropriate scale (~1 km2 grid cell) - Rigorous sampling design - Statewide coverage - Sampling- multiple years/ site - Trained/ experienced observers - Recently completed
Data Collection Typically random Scale Very coarse Temporal Issues Generally not addressed Reliability Variable Coverage Poor Comparison of Approaches Species List Verification Data Sample Size Very small Much larger Systematic Close to map scale Known for each dataset Defined by sample design Limited to comprehensive
Conclusions • Best approach: Occurrence/ verification data • Species lists inadequate for accuracy assessment • Verification data do exist • Best available science