Download
1 / 32
320 likes | 465 Views
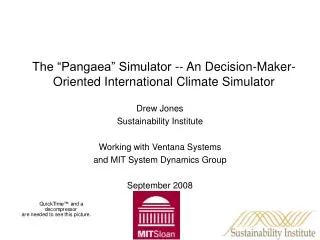
The “Pangaea” Simulator -- An Decision-Maker-Oriented International Climate Simulator. Drew Jones Sustainability Institute Working with Ventana Systems and MIT System Dynamics Group September 2008. Simulation Creation Team. Lead Modeler Dr. Tom Fiddaman, Ventana Systems

E N D
The “Pangaea” Simulator -- An Decision-Maker-Oriented International Climate Simulator Drew Jones Sustainability Institute Working with Ventana Systems and MIT System Dynamics Group September 2008
Simulation Creation Team • Lead Modeler • Dr. Tom Fiddaman, Ventana Systems • http://www.metasd.com/index.html • Modeling, Framing, and Presentation Design • Andrew Jones, Sustainability Institute • http://www.sustainabilityinstitute.org/ • apjones@sustainer.org • Dr. Lori Siegel, contractor to SI • Modeling and Framing • Dr. John Sterman, MIT • http://web.mit.edu/jsterman/www/
“Climate Interactive” is a growing coalition of business, academic, & nonprofit organizations Creating a portfolio of fast, accessible, robust, transparent simulations to help address climate change
Climate Interactive Senior Team Members • Dr. John Sterman, MIT Sloan School of Management • Director, System Dynamics Group • Author, Business Dynamics: Systems Thinking and Modeling for a Complex World Dr. Peter Senge, MIT Senior Lecturer, Sloan School of Management Founding Chairman, Society for Organizational Learning Author, The Fifth Discipline Dr. Michelle Erickson, Citigroup Director, Sustainable Information Technology Program • Dr. Bill Moomaw, The Fletcher School, Tufts University • Director of the Center for International Environment & Resource Policy • Lead author, Intergovernmental Panel on Climate Change 2003 (IPCC)
Purpose of Simulator is to Help Decision Makers Understand Dynamics of Climate Mitigation Inputs Outputs • Fossil fuel emissions by countries or “economy group” • Land use emissions • Additional sequestration from aforestation • Other greenhouse gas emissions • CO2 in the atmosphere • Global temperature • Total emissions • Total removals to oceans, biomass etc. • Sea level rise Emissions from Developed Major Economies And Developing Major Economies One goal And Non-Major Economies CO2 in the atmosphere
Simulator Helps Users Conduct Customized Tests: What If…..? (all graphs fossil fuel emissions) Business as usual All reduced 80% by 2050? Or by 2030? Developed Developing Non Major Some by 2030 and others 2060? Developed acts but undeveloped doesn’t? Starting in 2018?
What Would Be the Effect on CO2 Concentrations in the Atmosphere Over Time?
What Would Total Emissions Looks Like, Divided by Economy Group, since 1900? (fossil fuel emissions) NonME Developing Developed MEs
How About for Specific Countries? (fossil fuel emissions) India China Japan Russia EU US
Or Cumulative Fossil Fuel Emissions? India China Japan Russia EU US
What If We Boost Removals With Sequestration Through Aforestation? C O 2 i n t h e A t m o s p h e r e S o u r c e s o f T o t a l R e m o v a l s 8 0 0 6 B 7 0 0 4 . 4 7 5 B oceans TonC/year 2 . 9 5 B 6 0 0 seq. ppm 1 . 4 2 5 B 5 0 0 Goal biomass - 1 0 0 M 1 9 0 0 1 9 3 0 1 9 6 0 1 9 9 0 2 0 2 0 2 0 5 0 2 0 8 0 4 0 0 T i m e ( y e a r ) 3 0 0 2 0 0 0 2 0 2 0 2 0 4 0 2 0 6 0 2 0 8 0 2 1 0 0 Results with 80% reduction in fossil fuel emissions plus 1.6 GTC/year in additional sequestration by 2050
Users Move Sliders to Select “What If” Experiments Using the Prototype Control Panel
Exploring Implications of Uncertainty in Parameters Through Sensitivity Testing
Overview of Model Structure Specific country emissions Developing major economies Other GHGs Specific country emissions Total fossil fuel CO2 emissions Carbon cycle Developed major economies Climate Temp GHGs in atm Specific country emissions Land use CO2 emissions Non major economies CO2 Sequestration Changes to: Aforestation Deforestation Forests
The Core of the Carbon Cycle Sector (7 layers) (7 layers)
We Use Metaphors to Help Explain Model Behavior:Think of CO2 in the Atmosphere as a Bathtub The tub is filled by emissions and drained by net removals into oceans and biomass. The inflow is roughly double the outflow Emissions CO2 in the atmosphere Net Removals The “flat path” caps emissions above removals. More is still flowing into the bathtub than is flowing out. So the level of water in the bathtub continues to rise.
For Example: 80% Reduction Brings Emissions Down to Meet Removals T o t a l E m i s s i o n s a n d R e m o v a l s Emissions 2 4 B CO2 in the atmosphere 1 8 B TonC/year 1 2 B Emissions 6 B Net Removals 0 Net Removals 2 0 0 0 2 0 2 0 2 0 4 0 2 0 6 0 2 0 8 0 2 1 0 0 So levels of CO2 in the atmosphere stabilize.
Our Simulator Use Philosophy • Runs fast for high-iteration model testing • Model simulates 500 years in less than .1 second • Allows for practical analysis in areas such as uncertainty, trade-offs, optimization, and robustness • Hands-on use by policy-makers • Simulators designed to be used easily on a laptop by non-modelers • Transparency • We share model equations • No black box models • Understanding causes of dynamics • We take the time to ensure users understand why the model is doing what it is doing. We don’t say, “because the model says so”.
Simulator to Benefit From and Supplement Other Models • Pangaea uses data, structure and insights from other, larger, more disaggregated and detailed models • EG, the Integrated Assessment Models (IAMs) • Nations model generates internally consistent scenarios that could be tested and refined and verified in larger models • Our purpose is to create a small model and make it useful to policy setting and learning about complex dynamics
We Have Calibrated Our Future Global Fossil Fuel Emissions to Track MiniCAM Most Closely Global Fossil Fuel Emissions 40 B 30 B 20 B tonsC/year 10 B 0 1990 2010 2030 2050 2070 2090 Time (year) World CO2 FF emissions : BAU MiniCAM EMF14 Standard Reference CETA EMF14 Standard Reference AIM96 Standard Standard Reference ASF SRES A1 Data
EU Emissions Calibration US Emissions Calibration 4 B 4 B 3 B 3 B 2 B tonsC/year 2 B tonsC/year 1 B 1 B 0 0 1990 2010 2030 2050 2070 2090 1990 2010 2030 2050 2070 2090 Time (year) Time (year) CO2 FF emissions[US] : BAU CO2 FF emissions[EU] : BAU USA MiniCAM EMF Stnd Ref EU Emissions AIM EMF16 Mod Ref US Emissions AIM EMF16 Mod Ref India Emissions Calibration China Emissions Calibration 4 B 8 B 6 B 3 B tonsC/year 4 B 2 B tonsC/year 2 B 1 B 0 0 1990 2010 2030 2050 2070 2090 1990 2010 2030 2050 2070 2090 Time (year) Time (year) CO2 FF emissions[China] : BAU CO2 FF emissions[India] : BAU China MiniCAM EMF Stnd Ref India MERGE3 Ref China AIM96 Standard Scenario We Have Calibrated Our Country-Level Fossil Fuel Emissions to Track MiniCAM, AIM, and MERGE
We Compared Our Model’s Business as Usual Scenario for CO2 Concentrations to Other Models IPCC CO2 Atm Conc Models vs Nations Model 1,000 750 500 ppm 250 0 1990 2000 2010 2020 2030 2040 2050 2060 2070 2080 2090 2100 Time (year) ppm CO2 in Atmosphere : BAU MiniCAM Stnd Ref CETA EMF14 Stnd Ref RICE EMF14
We Compared Our Model’s Response to the MiniCAM Business as Usual Fossil Fuel Emissions Scenario CO2 concentration in the atmosphere Result when our carbon cycle is fed by MiniCAM’s emissions 800 400 ppm 0 1990 2010 2030 2050 2070 2090 Time (year) Our Model MiniCAM
We Compared Our Model’s Response to the MiniCAM “Accelerated Tech” Reduction Fossil Fuel Emissions Scenario CO2 concentration in the atmosphere 600 Result when our carbon cycle is fed by MiniCAM’s emissions 400 ppm 200 1990 2020 2050 2080 Time (year) Our Model MiniCAM
More information • Models on which the model that created these runs were based • http://www.metasd.com/models/index.html#Climate • Interactive version covering some of these ideas • http://www.seed.slb.com/en/scictr/watch/climate_change/challenge.htm • http://www.sustainabilityinstitute.org/tools_resources/climatebathtubsim.html • http://web.mit.edu/jsterman/www/GHG.html • Video version • http://video.google.com/videoplay?docid=8235725143334110601&pr=goog-sl • Other related simulations • http://www.sustainabilityinstitute.org/climate_change/simulations.html \ • Project blog • http://climateinteractive.wordpress.com/ • For an interactive, online demonstration, contact • apjones@sustainer.org