Download
1 / 17
170 likes | 239 Views
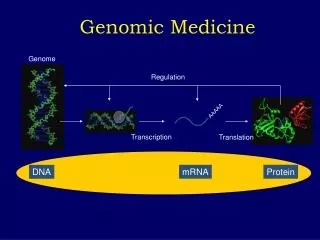
Explore the latest research in genome informatics, computational analysis, RNA structure prediction, gene expression, and regulatory sequence identification presented by leading experts at the conference. Discover innovative tools and methodologies for understanding genetic data.

E N D
Genome Informatics 2005 • ~ 220 participants • 1 keynote speaker: David Haussler • 47 talks • 121 posters
Rodger Voelker:Two classes of splice junctions • Search for 5-7 base motifs in exonic and intronic flanking sequences of known splice junctions • Computational analysis of collocations between different motifs • Many collocations between exonic and intronic sequences • Known ESEs display collocations with intronic sequences (including ISEs) • Nearly all introns (89%) can be classified into 2 classes
Chip Lawrence: futility of optima in inferences • The strong focus in bioinformatics on optimal solutions is fundamentally flawed, because the asymptotic underpinnings of these solutions, such as consistency, do not apply • The curse of dimensionality can render optimal solutions very unlikely and misleading • Example: minimum free energy predictions of RNA structures • Reason: incomplete energy function used, only sec structure considered, no tertiary
Minimum free energy predictions of RNA structures • Assumption: • molecule folds into lowest energy state • unique solution to folding problem (optimum) • Many programs (e.g. Zuker's Mfold) use the Boltzmann probability function • Most include calculations of suboptimal structures • but not all structures are computed • PPV of MFE: 48 %
Alternative prediction of RNA structures • Sample the ensemble of sec structures in proportion to their Boltzmann weights • Cluster the structures • Use centroid structure in predictions • Improved PPV compared to MFE • Srna module of Sfold (http://sfold.wadsworth.org/ )
Alternative prediction of RNA structures • Improved PPV compared to MFE: • Ensemble centroid + 30 % • Largest cluster centroid +18 % • Best centroid + 47 %
Data mining • Geneseer – searchable name-translation database (http://geneseer.cshl.org/ ) • Access to genomic information through gene names • Mapping sequences to gene names • Identification of homologs across several species for a given gene • Used in RNAi Codex (http://codex.cshl.edu )
Data mining • Ulysses – annotate human genes based on gene interactions in model organisms(http://www.cisreg.ca:8080/ulysses/ ) • Interologs: conserved protein-protein interactions • Regulogs: conserved protein-DNA interactions • Almost no overlap between data in interaction databases • BIND DIP: 984 refs; BIND 5 DB's: 3 refs
Data mining • Integrated Genome Browser (IGB) – visualize: • Genomic annotations from multiple data resources • Experimental data from Affymetrix arrays (http://www.affymetrix.com/support/developer/tools/download_igb.affx )
Gene expression and pathways • Skypainter tool in Reactome database: • allows overlay of gene expression data on pathway graphs • allows generation of a "movie" of a time series • (http://www.reactome.org/ )
Gene expression • ArrayBlast: • Compares gene expression signatures generated on different platforms • Uses public microarray data sets (GEO) • Used to create conserved cancer-related expression signature • (http://seq.mc.vanderbilt.edu/arrayBlast/ )
Gene expression • C. elegans Gene Expression Consortium: • SAGE data from specific stages, tissues and cell types • Database of gene expression data/pictures/movies of transgenic worms with promoter::GFP fusions for 2000 genes with human orthologs (http://elegans.bcgsc.ca/home/ge_consortium.html )
Michael Caudy: Whole genome analysis of combinatorial and architectural transcription codes • Search for TFBS in known neural pathway genes • Determine architecture: number, type, order, orientation and spacing of TFBS • Compare architecture of activated and repressed genes • Determine activity of promoters with TFBS mutations • Architecture is critical for differential response to Notch signalling
Regulatory sequence identification • Evoprinter: • highlights multi-species conserved sequences within orthologous DNAs in the context of a single species of interest • (http://evoprinter.ninds.nih.gov/ )
Regulatory sequence identification • NestedMICA: • method for discovering many over-represented short motifs in large sets of strings in a single run • candidate transcription factor binding sites • (http://www.sanger.ac.uk/Software/analysis/nmica/ )