Download
1 / 19
190 likes | 285 Views
Explore tested knowledge and application level indicators for the 10th grade KS Math Assessment. Access online resources to practice concepts, from addition and multiplication properties to linear equations and data analysis.

E N D
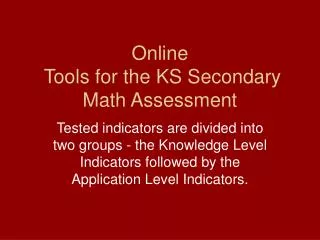
Tested indicators are divided into two groups - the Knowledge Level Indicators followed by the Application Level Indicators. Online Tools for the KS Secondary Math Assessment
Knowledge Indicators • There are 8 knowledge level indicators on the 10th grade KS Math Assessment: • The tested indicators are listed in order beginning with Standard 1, continuing through Standard 4. • Each indicator has a link to an online resource practiced. that explains the math concept and another resource where the concept may be practiced.
M.10.1.2.K3a-e • Can be summarized as the properties of addition and multiplication, zero property, substitution property, and symmetry property. There are 8 items on the assessment for this indicator. One of the easier indicators and it makes up nearly 10% of the test! Definitions and Practice from AAA Math • Addition Properties and Practice • Multiplication Properties and Practice
M.HS.2.2.K3c • Solve: systems of linear equations with two unknowns using integer coefficients and constants. (6 test questions for this indicator!) • Definitions/Examples/Methods • Practice - Choose a method and get started!
M.HS.2.3.K6 • Recognize how changes in the constant and/or slope within a linear function changes the appearance of a graph (5 questions assessed). • Definition/Explanation • Practice Opportunities • Try GeoGebra!
M.HS.3.4.K4 • Find and explain the relationship between the slopes of parallel and perpendicular lines. Given a standard linear equation find the slope of the line and the line that is perpendicular. (6 questions assessed) • Explanations/Definitions • Practice1 Practice2Practice3
M.HS.4.1.K3 • Explain the relationship between probability and odds and compute one given the other. (4 questions assessed) • Definitions/Examples • More Definitions/Examples • Practice
M.HS.4.2.K4 • Explain the effects of outliers on the measures of central tendency (mean, median, mode) and range and interquartile range of a real number data set. (4 questions assessed) • Definitions/Explanations • Practice
M.HS.4.2.K5 • Approximate a line of best fit given a scatter plot and make predictions using the equation of that line…7 questions! • Definitions/Examples • Practice1 Practice2
Application Indicators • There are 7 application level indicators on the 10th grade KS Math Assessment: • The tested indicators are listed in order beginning with Standard 1, continuing through Standard 4. • Each indicator has a link to an online resource practiced. that explains the math concept and another resource where the concept may be practiced.
M.HS.1.3.A1 • Adjust an original rational number estimate of a real world application and then adjust the estimate when given additional information. 5 questions • Definitions/Examples • Practice
M.HS.1.4.A1a,b,d • Generate and/or solve real world problems using computational procedures (+,-,X,/). Use applications from business, chemistry and physics, calculate volume and surface area, calculate principal and interest over time. 5 questions • Description • Practice
M.HS.2.2.A2a • Represent and/or solve real world problems. Use linear equations and inequalities both analytically and graphically. 6 questions • Definitions/Examples • Practice
M.HS.2.3.A2 • Interpret the meaning of the x and y intercepts, slope, and points on and off the line on a graph. Ex: A line on a graph represents a water tank being emptied. 6 questions • Examples • Practice
M.HS.3.1.A1b • Use the Pythagorean Theorem to solve real world problems. 4 questions • Example/Description • Practice
M.HS.3.3.A1 • Analyze the impact of transformations on perimeter and area: what happens to area when perimeter is reduced by a factor of ½? To volume? • Description/Examples • Practice
M.HS.4.2.A1a-h • Use data analysis in real world problems to compare and contrast two sets of data, to make accurate inferences and predictions, to analyze decisions and make convincing arguments. 5 questions. • Explanation/Examples • Practice
Formative Assessment • BAIP • TestBuilder • Kan-Ed
Online Resources for the KS Secondary Math Assessment • By • Andy Ewing • Kansas Infinitec Math Trainer • http://technology4math.pbworks.org