Download

1 / 31
310 likes | 451 Views
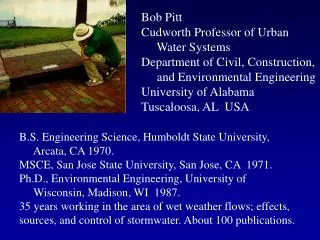
Bob Pitt Cudworth Professor of Urban Water Systems Department of Civil, Construction, and Environmental Engineering University of Alabama Tuscaloosa, AL USA. B.S. Engineering Science, Humboldt State University, Arcata, CA 1970.

E N D
Bob Pitt Cudworth Professor of Urban Water Systems Department of Civil, Construction, and Environmental Engineering University of Alabama Tuscaloosa, AL USA B.S. Engineering Science, Humboldt State University, Arcata, CA 1970. MSCE, San Jose State University, San Jose, CA 1971. Ph.D., Environmental Engineering, University of Wisconsin, Madison, WI 1987. About 40 years working in the area of wet weather flows; effects, sources, and control of stormwater. About 100 publications, including several books.
Modeling Green Infrastructure Components in a Combined Sewer Area Robert Pitt, Ph.D., P.E., D.WRE, BCEE Department of Civil, Construction, and Environmental Engineering University of Alabama Tuscaloosa, AL, USA 35487 John Voorhees, P.E., P.H. AECOM, Inc. Madison, WI
Kansas City’s CSO Challenge • Combined sewer area: 58 mi2 • Fully developed • Rainfall: 37 in./yr • 36 sewer overflows/yr by rain > 0.6 in; reduce frequency by 65%. • 6.4 billion gal overflow/yr, reduce to 1.4 billion gal/yr • Aging wastewater infrastructure • Sewer backups • Poor receiving-water quality
Kansas City Middle Blue River Outfalls • 744 acres • Distributed storage with “green infrastructure” vs. storage tanks • Need 3 Mgal storage • Goal: < 6 CSOs/yr 4
Kansas City’s Original Middle Blue River Plan with CSO Storage Tanks 1/26/2009
KC’s Modeling Connections • KCMO XP-SWMM • - Drainage (Transport) • Design Objectives • SUSTAIN-SWMM • Individual LID • Drainage (Transport) • Multi-scale • - Subarea Optimization • WinSLAMM • Land Surface Characteristics • Drainage (Transport) • Design Options • Stormwater Beneficial Uses • - Multi-scale Weight of Evidence
Project Strategy and Modeling Porous Pavement Sidewalk • Conventional CSO evaluations were conducted using XP_SWMM in order to identify the design storm for the demonstration area that will comply with the discharge permits. • XP_SWMM was also used by KCMO Water Services Department, Overflow Control Program, to examine different biofiltration and porous pavement locations and storage options in the test watershed.
Project Strategy and Modeling (cont.) • WinSLAMM is being used to quantify benefits for different applications of many stormwater controls in the test watershed with continuous simulations. It is also being used to examine capital and maintenance costs, along with quantify the maintenance schedules needed for the different alternatives. Decision analysis considering many project objectives is also being supported by WinSLAMM.
Control Devices Included in WinSLAMM Hydrodynamic devices Development characteristics Wet detention ponds Porous pavement Street cleaning Green roofs Catchbasin cleaning Grass swales and grass filtering Biofiltration and bioretention Cisterns and stormwater use Media filtration/ion exchange/sorption
Major Land Use Components in Residential Portion of Study Area (% of area and % of total annual flow contributions) Based on KCMO GIS mapping and detailed site surveys, along with WinSLAMM calculations.
Water Harvesting Potential of Roof Runoff Irrigation needs for the landscaped areas surrounding the homes were calculated by subtracting long-term monthly rainfall from the regional evapotranspiration demands for turf grass.
Soil Infiltration Rate Monitoring Clusters of three small Turf-Tec infiltrometers were used at each monitored location to obtain site infiltration rates.
Long-duration Site Infiltration Rates This plot shows the time-averaged infiltration rates based on the individual incremental values. The surface infiltration rates are less than 1 in/hr for rains about 2 hrs long. Additional site measurements and deep soil profiles have indicated that infiltration rates are quite low for most of the area. Therefore, 0.2 in/hr was used during these evaluations.
Modeling of Controls for Directly Connected Roof Runoff This presentation focuses on the results of recent modeling efforts examining rain barrels/water tanks and rain gardens to control the annual runoff quantity from directly connected roofs. The modeling is being expanded as the curb-cut biofilter designs are finalized. Kansas City curb cut rendering
Reductions in Annual Flow Quantity from Directly Connected Roofs with the use of Rain Gardens (Kansas City CSO Study Area)
Household water use (gallons/day/house) from rain barrels or water tanks for outside irrigation to meet ET requirements:
Water Use Calculations in WinSLAMM WinSLAMM conducts a continuous water mass balance for every storm in the study period. For rain barrels/tanks, the model fills the tanks during rains (up to the maximum amount of runoff from the roofs, or to the maximum available volume of the tank). Between rains, the tank is drained according to the water demand rate. If the tank is almost full from a recent rain (and not enough time was available to use all of the water in the tank), excess water from the event would be discharged to the ground or rain gardens after the tank fills.
Basic Rain Barrel/Water Tank Input Screen in WinSLAMM (same as for biofilters, but no soil infiltration and with water use profile)
Reductions in Annual Flow Quantity from Directly Connected Roofs with the use of Rain Barrels and Water Tanks (Kansas City CSO Study Area)
0.12 ft of storage is needed for use of 75% of the total annual runoff from these roofs for irrigation. With 945 ft2 roofs, the total storage is therefore 113 ft3, which would require 25 typical rain barrels, way too many! However, a relatively small water tank (5 ft D and 6 ft H) can also be used.
Interactions of “Green Infrastructure” Controls being Evaluated in the Kansas City CSO Study Area • When evaluated together, rain barrels/tanks collect the roof runoff first (for later irrigation use); the excess water can be discharged to the rain gardens. Overflow from the rain gardens is directed to the curb-side drainage system and biofilters. • All of the site water (from the excess from the roof treatment systems or other upland controls and all other areas) is collected in the curb-side drainage system. The curb-cut biofilters are modeled as a cascading swale system where the site runoff is filtered and allowed to infiltrate. If the runoff volume is greater than the capacity of the biofilters, the excessive water is discharged into the combined sewer. • As noted, the continuous simulations drain the devices between the runoff events, depending on the interevent conditions and water demand.
Interaction Benefits of Rain Barrels and Rain Gardens in the Kansas City CSO Study Area Two 35 gal. rain barrels plus one 160 ft2 rain garden per house can reduce the total annual runoff quantity from directly connected roofs by about 90%
Examples from “65%” plans prepared by URS for project streets. Plans reviewed and modeled by project team, and construction will occur in spring and summer of 2011.
Annual Runoff Reductions from Paved Areas or Roofs for Different Sized Rain Gardens for Various Soils
Clogging Potential for Different Sized Rain Gardens Receiving Roof Runoff Clogging not likely a problem with rain gardens from roofs
Clogging Potential for Different Sized Rain Gardens Receiving Paved Parking Area Runoff Rain gardens should be at least 10% of the paved drainage area, or receive significant pre-treatment (such as with long grass filters or swales, or media filters) to prevent premature clogging.
Conclusions • Extensive use of biofilters and other practices is needed in order to provide significant benefits to the combined sewer system. • It is likely that these “green infrastructure” components will be cost effective and provide additional neighborhood benefits. • Different models should be used to evaluate different aspects of complex problems. • The weight-of-evidence provided by independent evaluations decreases the uncertainty of complex decisions.