Download
1 / 69
700 likes | 868 Views
ENERGY. PATTERNS OF ENERGY FLOW IN ECOSYSTEMS. WHAT IS AN ECOSYSTEM?. Biological community plus all abiotic factors affecting the community. http://eesc.columbia.edu/courses/ees/life/lectures/lect02.html. LAWS OF THERMODYNAMICS. 1st LAW: 2nd LAW:. ENERGY SOURCES IN BIOSPHERE.

E N D
ENERGY PATTERNS OF ENERGY FLOW IN ECOSYSTEMS
WHAT IS AN ECOSYSTEM? Biological community plus all abiotic factors affecting the community http://eesc.columbia.edu/courses/ees/life/lectures/lect02.html
LAWS OF THERMODYNAMICS • 1st LAW: • 2nd LAW:
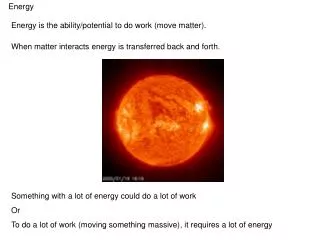
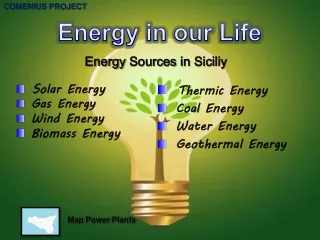
ENERGY SOURCES IN BIOSPHERE • Sunlight energy – driving force • Energy distribution and carbon dioxide in atmosphere shape ecosystems and biosphere • Biosphere energy and CO2 shape world climate and weather
CHARLES ELTON & FOOD WEBS • 1920s, Charles Elton and others proposed: • Organisms living in the same place not only have similar tolerances of physical factors, but • Feeding relationships link these organisms into a single functional entity • Food web http://www.history.vt.edu/Barrow/Hist3144/readings/ecology/index.html
Feeding relationships of the snowshoe hare-dominated food web in the boreal forest of northwestern Canada Dominant species in yellow
ALFRED J. LOTKA AND THE THERMODYNAMIC CONCEPT • Alfred J. Lotka
LINDEMAN’S SYNTHESIS 1942 – Raymond Lindeman brought Lotka’s ideas of the ecosystem as an energy-transforming machine to the attention of ecologists Incorporated: http://www.cedarcreek.umn.edu/people/photo/LindemanRaymond1942.jpg
LINDEMAN’S FOUNDATIONS OF ECOSYSTEM ECOLOGY • Ecosystem is fundamental unity of ecology • Within an ecosystem, energy passes through many steps or links in a food chain
Cedar Bog Lake in Minnesota…site of Raymond Lindemen’s classic research paper in 1942: "The Trophic-Dynamic Concept in Ecology“. Ecology 23:399-418
ODUM’S ENERGY FLUX MODEL Recognized the utility of energy and masses of elements as common “currencies” in comparative analysis of ecosystem structure and function Eugene Odum http://www.researchmagazine.uga.edu/summer2002/odum.htm
ODUM EXTENDED HIS MODELS TO INCORPORATE NUTRIENT CYCLING • Fluxes of energy and materials are closely linked in ecosystem function • But: • Energy enters ecosystems as light and is degraded into heat • Nutrients cycle indefinitely, converted from inorganic to organic forms and back again • Studies of nutrient cycling provides index of energy fluxes
Single trophic level Example food chain Odum’s “universal” model of energy flow, which can be applied to any organism
Energy dissipated as heat SUN Producers Consumers Detritus + Decomposers Inorganic nutrients Nutrient pool Import Export Energy Flow Nutrient Cycling
AUTOTROPHS - PRODUCERS Photoautotrophs - Chemoautotrophs – Primary producers – Transform sunlight energy to chemical energy Sugars, starch, ATP http://www.scienceclarified.com/images/uesc_01_img0028.jpg http://141.150.157.117:8080/prokPUB/figures/normal/p323-006.jpg
PRIMARY PRODUCTION • Producers capture energy of light • Transform sunlight energy into energy of chemical bonds in carbohydrates • 6CO2 + 6H2O → C6H12O6 + 6O2 • For each g of C assimilated, 39 kj energy stored • Gross primary production = total energy assimilated by primary producers • Net primary producion = energy accumulated (in stored form) by primary producers • GPP – NPP = Respiration • Energy consumed by producers for maintenance and biosynthesis
Energy lost and unavailable to consumers Partitioning gross primary productivity into respiration and net primary productivity GPP NPP
NUTRIENTS STIMULATE PRIMARY PRODUCTION • Terrestrial production may be nutrient limited • Aquatic systems often strongly nutrient-limited
Effects of fertilization with N & P on primary production in a salt marsh dominated Carex subspathecea in southern Hudson Bay, Canada.
AQUATIC ECOSYSTEMSRESPONSIVE TO PHOSPHORUS 1975 1994 http://www.umanitoba.ca/institutes/fisheries/eutro.html
Slow-moving coastal plain stream choked with algal bloom caused by nitrogen and phosphorus from upstream farmland. http://wps.prenhall.com/wps/media/objects/57/58641/51_8089ic.gif
GLOBAL PRIMARY PRODUCTION • Correlates with annual precipitation (when light not limiting) • Note relationship among tundra, deserts, and tropics • Oceans – nutrient poor • CO2 Source of carbon • Follows 1st Law of Energy
Grams carbon/m2/yr for globe, as calculated from satellite imagery. Oceans = 46%, land = 54%
PRIMARY PRODUCTION VARIES AMONG ECOSYSTEMS • Maximum under favorable conditions
HETEROTROPHS - CONSUMERS • Get energy from external sources • “Animals” • Primary consumers • Secondary consumers • Tertiary consumers • Carnivores • Decomposers • Detritivores • Eat dead organic matter
Tertiary consumers Decomposers Secondary consumers Primary consumers Primary producers
Tertiary consumers Decomposers Secondary consumers Primary consumers Primary producers
ECOLOGICAL PYRAMIDS Trophic levels placed in order Reflects: Numbers of organisms at each level Biomass of each level Energy at each level
ECOLOGICAL PYRAMIDS Elton observed predators tended to be larger and less numerous than their prey - described as the ‘pyramid’ of numbers or biomass Elton hypothesized that this occurred because predators have to be larger than prey
PYRAMID OF NUMBERS # CONSUMERS=TOP CARNIVORES # DECOMPOSERS # CONSUMERS # HERBIVORES # PRIMARY PRODUCERS
PYRAMID OF BIOMASS kg CONSUMERS=TOP CARNIVORES kg CONSUMERS kG DECOMPOSERS kg HERBIVORES kg PRIMARY PRODUCERS
PYRAMID OF ENERGY kJ CONSUMERS=TOP CARNIVORES kJ CONSUMERS kJ DECOMPOSERS kJ HERBIVORES kJ PRIMARY PRODUCERS
NUMBERS PYRAMID http://www.bbc.co.uk/schools/gcsebitesize/img/bi01010.gif
BIOMASS AND (NUMBERS) PYRAMID
Energy pyramids can never be inverted, but biomass pyramids can be inverted when lower trophic levels are dominated by palatable and small organisms that turnover rapidly