Download
1 / 14
140 likes | 298 Views
Toolsets for Airborne Data. Earth Science Information Partners – Summer Meeting Aubrey Beach, Amanda Early, Lindsay Parker, Gao Chen July 10, 2014. Airborne Data Description.

E N D
Toolsets for Airborne Data Earth Science Information Partners – Summer Meeting Aubrey Beach, Amanda Early, Lindsay Parker, Gao Chen July 10, 2014
Airborne Data Description • Aircraft measurement of atmospheric trace species (e.g., trace gases or aerosol properties) can generally be classified as remote sensing and in-situ measurements • An in-situ measurement typically involves the collection of an air sample through an inlet mounted on the aircraft fuselage. • The air sample is then analyzed by instruments onboard the aircraft. • Data from recent studies reported in ICARTT format – a NASA standard
Why Use Airborne Data? • High spatial and temporal resolutions • Large number of simultaneous measurements, which include a much broader array of variables than space and most ground-based long-term measurement sites • Used to characterize specific atmospheric processes • Often used as benchmarks for assessing and evaluating models and satellite observations
Complexities with Airborne Data • Each field study may involve multiple aircraft • Each aircraft may have 20-50 instruments onboard, which can generate 100’s of variables and parameters • Ex. SEAC4RS (Studies of Emissions and Atmospheric Composition, Clouds and Climate Coupling by Regional Surveys) • 3 aircraft, 53 research groups, 80+ instruments = 400 variables! • No consistent variable naming convention across field campaigns • Instruments often report data on different time scales and intervals • Ex. Aircraft navigational data reported continuously at a 1 second time interval, whereas a whole air sampler provides measurements at a ~60 second time interval
Idealized ICARTT Format • ICARTT Format Issues • Inconsistent variable naming • "Number Density for Particles Larger than 10 nm” • DISCOVER-AQ: "CN>10nm” • INTEX-B: "cold_aerosol_per_cm3" • Lack of units or description • Special characters in comments • Inconsistent delimiters Database Schema
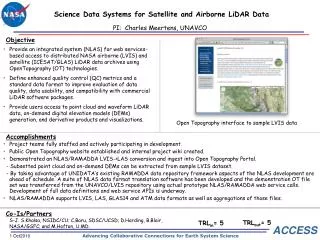
TAD – Motivation and Design NASA has conducted airborne tropospheric chemistry studies for about three decades. These field campaigns have generated a great wealth of observations, including a wide range of the trace gases and aerosol properties. The ASDC Toolset for Airborne Data (TAD) is being designed to meet the user community needs for manipulating aircraft data for scientific research on climate change and air quality relevant issues.
Aircraft measurement metadata • Mission/Platform • Date/time • Instrument • Variable & definition • PI contact information • Data reporting conditions: STP or Ambient, mixing ratio or concentrations • Uncertainties, LODs • Data flags
Common Naming System Diagram? Common Naming System Frequency Flag Level Two #:#:#(#)_name Variable Common Name Level One Level Three
Timebase Data Merge tpj Data ID Timebase Δtpj Merge Timebase tmi Δtmi DISCOVER-AQ 2013 P3B Flight Path
Weighted Average , if PI data value , if Merged data value , if • Weighting factor (Wij) based on overlap between the PI measurement time interval (tpj) and the target time interval (tmi) • Merge module handles uncertainty propagations • Special handling of wind direction averages
Future Enhancements • Data Set Upload • Allow user to directly submit data to TAD back-end database • Data Subsetting Tools • Temporal/Spatial subsetting • Visualization Tools • Examine specific parameters over geographic regions