Download
1 / 40
400 likes | 414 Views
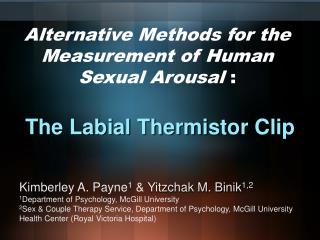
The measurement of alternative androgens in the investigation of PCOS Brian Keevil. Diagnosis and treatment of polycystic Ovary syndrome: An Endocrine Society Clinical Practice Guideline.

E N D
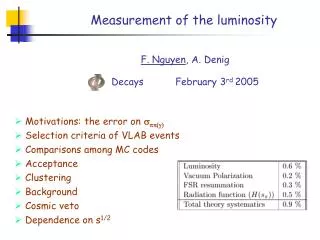
The measurement of alternative androgens in the investigation of PCOSBrian Keevil
Diagnosis and treatment of polycystic Ovary syndrome: An Endocrine Society Clinical Practice Guideline Richard S. Legro, Silva A. Arslanian, David A. Ehrmann, KathleenM. Hoeger, M. Hassan Murad, RenatoPasquali, and Corrine K. Welt JCEM 2013;98:4565-4592 • ‘Biochemical hyperandrogenism refers to an elevated • serum androgen level and typically includes • Testosterone • Free testosterone • Bioavailable testosterone’
Testosterone Changes in binding proteins greatly affect measured total T genetic SHBG variants estrogen treatment critical illness and sepsis SHBG T T T T T albumin T 60-80% Free Total serum testosterone(T): 1-2% Bioavailable 20-40%
Pre- and Post-menopausalAndrogen Excess • Polycystic Ovarian Syndrome • Hyperthecosis • Obesity induced Hyperandrogenism • Ovarian or adrenal tumor • Congenital adrenal hyperplasia • Other: DRUGS, exogenous androgens, • Prolactinoma • Cushing’s syndrome
Diagnostic process Testosterone Testosterone / SHBG =Free Androgen Index Androstenedione + DHEAS 17OHP
Niche Immunoassay analysers Immulite Kryptor Liaison iSYS
Testosterone (female) UKNEQAS Kind permission of Finlay Mackenzie
Androstenedione UKNEQAS Kind permission of Finlay Mackenzie
Comparison of steroidogenic pathways among normoandrogenic and hyperandrogenic polycystic ovary syndrome patients and normal cycling women • 262 women with hyperandrogenic PCOS • 93 women with normoandrogenic PCOS • 114 non PCOS women with normal cycles • NA and HA PCOS showed no difference in body weight • Both had higher insulin and LH than non PCOS De Medeiros J ObsGynae Res 2014
Comparison of steroidogenic pathways among normoandrogenicand hyperandrogenic polycystic ovary syndrome patients and normal cycling women • HA PCOS patients • 3βHSD activity higher (p<0.05) • 17,20 lyase activity higher (p<0.0001) • Aromatase activity lower ( p<0.05) • Compared to NA PCOS patients and normal cycling women Conversion of 17OHpreg to cortisol was lower in the HA PCOS and NA PCOS than normal cycling women De Medeiros J ObsGynae Res 2014 Häggström M, Richfield D (2014). "Diagram of the pathways of human steroidogenesis". Wikiversity Journal of Medicine1 (1
Androgen profile through life in women withpolycystic ovary syndrome: A Nordic multicenter collaboration study • 651 women with PCOS • 230 controls Main outcome measures • Testosterone, Androstenedione, DHEAS • FAI, cFT Pinolaetal JCEM 2015
Androgen profile through life in women with polycystic ovary syndrome: A Nordic multicenter collaboration study Pinola et al JCEM 2015
Androgen profile through life in women withpolycystic ovary syndrome: A Nordic multicenter collaboration study Pinola et al JCEM 2015
Adrenal Androgen Excess and Body Mass Index in Polycystic Ovary Syndrome Moran JCEM 2015
The Impact of Simultaneous Measurement of Testosterone and Androstenedione in Women with Suspected Androgen Excess 1436 female samples received in the laboratory for assessments of androgen status, 560 had at least one raised androgen Duxbury et al ClinChem 2007
Hyperandrogenaemia predicts metabolic phenotype in PCOS; the utility of serum androstenedioneO‘Reilly MW, Taylor AE, Crabtree NJ, HughesBA, Capper F,Crowley RK, Stewart PM, Tomlinson JW,* and Arlt W • 86 PCOS patients with confirmed diagnosis • 56 patients had high T and high A4 • 30 patients had normal T 20 patients had high A4 10 patients had normal A4 J ClinEndocrinolMetab. 2014 Mar; 99(3): 1027–1036.
NA/HT n=0 HA/HT n=56 HA/NT n=20 NA/NT n=10 O’Reilly MW JCEM 2014
A B C D O’Reilly MW et al. JCEM 2014
Testosterone to Dihydrotestosterone ratio as a New Biomarker for an Adverse Metabolic Phenotype in the Polycystic Ovary Syndrome 275 premenopausal PCOS patients - median age 26 years 35 controls - median age 35 years Munzker JCEM 2015
Testosterone to Dihydrotestosterone ratio as a New Biomarker for an Adverse Metabolic Phenotype in the Polycystic Ovary Syndrome In PCOS patients alone the TT/DHT ratio was significantly higher in Those with metabolic syndrome, obesity, IGT and insulin resistance Munzker JCEM 2015
Testosterone to Dihydrotestosterone ratio as a New Biomarker for an adverse Metabolic phenotype in the Polycystic Ovary Syndrome PCOS patients showed significantly higher values of • Testosterone p<0.001 • Free testosterone p<0.001 • Free DHT p<0.001 Compared to healthy controls The TT/DHT ratio was significantly higher in PCOS patients. Munzker JCEM 2015
Multiplexed steroids A42pmol/L ( 0.57 ng/mL) Testo2 pmol/L ( 0.57 ng/mL) 17OHP4 pmol/L ( 1.3 ng/mL) DHEA6.5 nmol/L (1.8 ng/mL) DHT0.4 nmol/L ( 0.1 ng/mL)
Androgen Profile in Young Women n=159 adolescent girls normal weight eumenohrreic 55 indeterminate 53 follicular 51 luteal Upper reference limits Luteal phase T= 0.557 ng/mL (2.0 nmol/L) FAI = 6.75 Folicular phase T= 0.447 ng/mL (1.56 nmol/L) FAI = 4.71 Fanelli JCEM 2013
Androgen Profile in Young Women 51 luteal – 18 anovultory 31 ovulatory Fanelli JCEM 2013
Conclusions • Testosterone is not the only useful biochemical marker for PCOS. • Androstenedione and DHT may have important roles to play • LC-MS/MS is a powerful tool for measuring multiple useful steroids
Steroids in saliva • Saliva only contains free unbound steroids • Moves easily into saliva via passive diffusion • Neutral steroids unaffected by increased flow rates Free-T Free-T *Thought to reflect circulating free and tissue levels of steroid Blood capillary Salivary duct Cortisol in saliva approximates very well to the free plasma concentration. Lipid insoluble steroids in saliva e.g DHEAS make up <1% of the free plasma concentration
Saliva collection • unstimulated passive drool Recommended protocol: • Mouth rinsed • No food intake 30 mins prior to collection • Volunteers had not brushed teeth within one hour before collection • Saliva allowed to pool in the mouth for 5 min • Aim to collect minimal volume of saliva of 1 mL • Saliva was drooled down plastic straw into collection vessel • Freeze/thaw before analysis to break down mucins
Sample stability 0.4 0.3 Testosterone (nmol/L) 0.2 0.1 0 1 2 3 4 5 Days at Room Temp At 4o C At ambient temperature After freeze / thawing
Diurnal variation in females Saliva P=0.01 Sal-T pmol/L am Mean = 25.7 pmol/L (SD=15 pmol/L) pm Mean = 15.1 pmol/L (SD=7.5 pmol/L)
LC-MS/MS Reference intervals (Age range 16-74) Female n=96 Male n=96 Mean= 16.0 Median=13.7 SD=9.2 95% confidence interval 5-46 pmol/L Mean = 215 Median= 205 SD= 79.8 95% confidence interval 93-393 pmol/L
National survey into sexual attitudes and lifestyle (NATSAL)Salivary testosterone Women n=1276 Men n= 1074
Healthy population-women sal-T (pmol/L) Mean sdmedian (IQR) • 18-24 61.8 40.8 50.6 (36.1-87.2) • 25-34 45.9 31.2 38.8 (27.2-58.7) • 35-44 40.4 32 31.8 (20.6-49.3) • 45-54 35.5 28.9 29 (19.0-40.7) • 55-64 27.6 17.6 23.3 (16.5-35.4) • 65-74 27.4 19 24.3 (15.1-33.2) (n=1276)
Conclusions • T can be reliably and accurately measured in saliva by LC-MS/MS in both male and female samples • Significant diurnal variations in salivary T levels are detectable in both males and females • Instruments with high sensitivity are needed to measure in the female range. • We need to explore the application of these techniques in different patient groups to establish their clinical utility. • T in saliva is stable –good for storage and transport
Acknowledgemnts Fred Wu Natsal team • Laura Owen • Jo Adaway