Download
1 / 16
220 likes | 1.14k Views
Analytical Ultracentrifugation. Analytical Ultracentrifugation – Applications. Determine sample purity Characterize assembly and disassembly mechanisms of biomolecular complexes Determine subunit stoichiometries Detect and characterize macromolecular conformational changes

E N D
Analytical Ultracentrifugation – Applications • Determinesample purity • Characterize assembly and disassembly mechanisms of biomolecular complexes • Determine subunit stoichiometries • Detect and characterize macromolecular conformational changes • Measure equilibrium constants and thermodynamic parameters for self- and hetero-associating systems characterize the solution-state behavior of macromolecules under various conditions
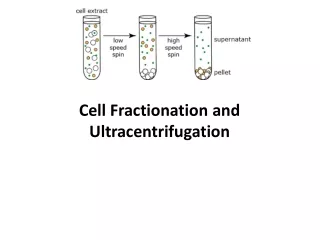
Analytical Ultracentrifugation – Design • analytical ultracentrifuge = preparative ultracentrifuge + optical detection system measure sample concentration inside the centrifuge cell during or after sedimentation • centrifugation parameters and data acquisition under computer control experiments lasting many days performed with minimal operator intervention
Analytical Ultracentrifugation – Design http://www-bioc.rice.edu/bios576/AU/AU%20Page_files/image022.jpg
Analytical Ultracentrifugation – Design: Optical systems • Absorbance optical system: measurement of sample concentration at wavelengths from 200 to 800 nm detection of macromolecules containing strong chromophores • Rayleigh interference optical system: measurement of sample concentration based on refractive index changes analyze macromolecules lacking intense chromophores (eg, polysaccharides) and samples that contain strongly absorbing buffer components (eg, ATP/GTP, DTToxidized)
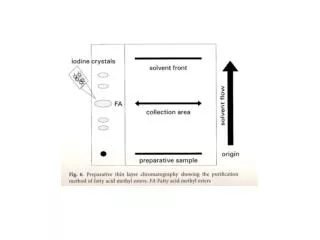
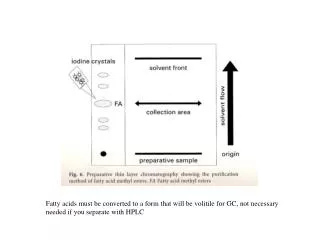
1-Analytical Ultracentrifugation – Sedimentation velocity experiments
Meniscus of solution Plateau conc. Concentration of solute Meniscus of solvent Sedimentation front Cell radius 1-Analytical Ultracentrifugation – Sedimentation velocity experiments Modified from http://www.kolloidanalytik.de/uz/sed/uzsedhr.gif
Experimentally, the data is gathered at high rotor speeds where the sedimentation transport dominates the diffusion. One measures a molecule's rate of transport from the top to the bottom of the cell. A sedimentation velocity experiment requires approximately 500 µg of sample protein in a volume of 1 ml.
1-Analytical Ultracentrifugation – Sedimentation velocity experiments • Hydrodynamic information • Experimentally determined parameters: • Sedimentation coefficient s • Diffusion constant D or friction factor f • Molecular mass M • Estimation of the molecule’s shape in solution
2-Sedimentation Equilibrium provides thermodynamic information • Experimentally, the data are collected at slower rotor speeds so that the sedimentation and diffusion forces can balance. • At sedimentation equilibrium, these forces are equal in magnitude, but opposite in direction, and the molecule is exponentially distributed across the cell. • There is no longer any net transport of molecules in the system. All shape factors are thus cancelled out, yielding the molecular weight. • A typical sedimentation equilibrium experiment requires 300 µl of sample at an OD of 0.8 at the wavelength of interest (usually 280 nm). This is generally on the order of 200-400 µg of total protein, but varies greatly depending on your protein's molar extinction coefficient.
Analytical Ultracentrifugation – Examples of Applications • Sedimentation velocity • Biomolecular Shape • Biomolecular Conformational Changes • Assembly and Disassembly of Biomolecular Complexes • Molecular Mass and Subunit Stoichiometry • Equilibrium Constants for Self-Associating Systems • Sedimentation equilibrium • Molecular Mass and Subunit Stoichiometry • Equilibrium Constants for Molecules