Download
1 / 1
10 likes | 115 Views
This project outlines a framework for designing energy-efficient smart sensor systems. The focus is on creating systems that intelligently analyze their state and environment. By improving power management techniques—such as selective data collection and adaptive sampling rates—we aim to extend battery life while maintaining performance. Using a decision tree approach, we enhance the classification of activities like walking and climbing stairs. Our design principles facilitate dynamic operation based on contextual needs, significantly benefiting various real-world applications.

E N D
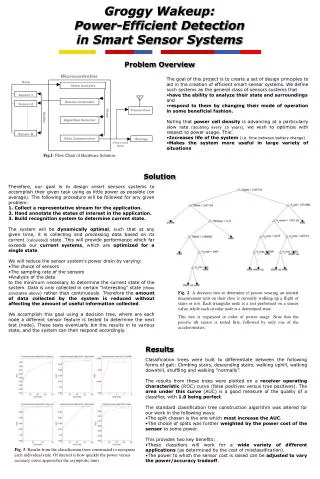
Fig.1: Flow Chart of Hardware Solution Groggy Wakeup: Power-Efficient Detection in Smart Sensor Systems Problem Overview • The goal of this project is to create a set of design principles to aid in the creation of efficient smart sensor systems. We define such systems as the general class of sensors systems that • have the ability to analyze their state and surroundings • and • respond to them by changing their mode of operation in some beneficial fashion. • Noting that power cell density is advancing at a particularly slow rate (doubling every 15 years), we wish to optimize with respect to power usage. This: • Increases life of the system(i.e. time between battery change) • Makes the system more useful in large variety of situations Solution • Therefore, our goal is to design smart sensors systems to accomplish their given task using as little power as possible (on average). The following procedure will be followed for any given problem: • Collect a representative stream for the application. • Hand annotate the states of interest in the application. • Build recognition system to determine current state. • The system will be dynamically optimal, such that at any given time, it is collecting and processing data based on its current (calculated) state. This will provide performance which far exceeds our current systems, which are optimized for a single state. • We will reduce the sensor system's power drain by varying: • The choice of sensors • The sampling rate of the sensors • Analysis of the data • to the minimum necessary to determine the current state of the system. Data is only collected in certain “interesting” state (those annotated above) rather than continuously. Therefore the amount of data collected by the system is reduced without affecting the amount of useful information collected. • We accomplish this goal using a decision tree, where are each node a different sensor feature is tested to determine the next test (node). These tests eventually bin the results in to various state, and the system can then respond accordingly. Fig. 2: A decision tree to determine if person wearing an inertial measurement unit on their shoe is currently walking up a flight of stairs or not. Each triangular node is a test performed on a sensor value, while each circular node is a determined state. This tree is organized in order of power usage. Note that the passive tilt sensor is tested first, followed by only one of the accelerometers. Results • Classification trees were built to differentiate between the following forms of gait: Climbing stairs, descending stairs, walking uphill, walking downhill, shuffling and walking “normally”. • The results from these trees were plotted on a receiver operating characteristic (ROC) curve (false positives versus true positives). The area under this curve (AUC) is a good measure of the quality of a classifier, with 1.0 being perfect. • The standard classification tree construction algorithm was altered for our work in the following ways: • The split chosen is the one which most increase the AUC. • The choice of splits was further weighted by the power cost of the sensor to some power. • This provides two key benefits: • These classifiers will work for a wide variety of different applications (as determined by the cost of misclassification). • The power to which the sensor cost is raised can be adjusted to vary the power/accuracy tradeoff. Fig. 3: Results from the classification trees constructed to recognize each individual state. Of interest is how quickly the power versus accuracy curve approaches the asymptotic limit.