Download
1 / 30
310 likes | 537 Views
Change in vegetation growth and C balance in the Tibetan Plateau. Shilong Piao , Kun Tan, Nan Cong, Xuhui Wang. Peking University. slpiao@pku.edu.cn. Motivation. Rapid climate warming. The Tibetan Plateau is one of the most critical and sensitive regions in the earth ’s climate system .

E N D
Change in vegetation growth and C balance in the Tibetan Plateau Shilong Piao, Kun Tan, Nan Cong, Xuhui Wang Peking University slpiao@pku.edu.cn
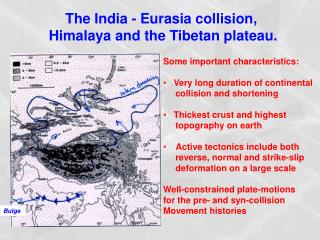
Motivation Rapid climate warming • The Tibetan Plateau is one of the most critical and sensitive regions in the earth’s climate system. • During the past five decades, the mean annual temperature of the plateau has increased by 0.4 oC per decade, a faster rate than the mean temperature trend over global land surface.
Motivation Precipitation change Data from CRU
Objectives Rising CO2 concentration Glboal warming Precipitation change How do vegetation growth and carbon storage change in response to change in climate and rising CO2?
Outline 1. Change in spring phenology 2. Change in carbon balance
Vegetation growth change Dataset • NDVI defined as the ratio of the difference between near-infrared reflectance and red visible reflectance to their sum, is an indicator of vegetation greenness.The NDVI data used in this study were from the GIMMS (Global Inventory Monitoring and Modeling Study) group derived from NOAA/AVHRR land dataset, with 8 km resolution for each 15 days from 1982 to 2006.
Vegetation growth change Climate Dataset • Monthly climate data recorded from 50 meteorological stations over the Plateau.
Spring phenology change Method to detect changes in the vegetation green-up date • Firstly, we calculate the averaged annual NDVI time series curve during 1982-2006 to determine the NDVI threshold of vegetation green-up in each pixel. • The threshold over 1982-2006 is defined as the NDVI value with the highest positive relative NDVI seasonal change; • We performed a least square regression analysis between NDVI data and the corresponding day of year (Julian day) • Finally, the annual green-up date is calculated as the day when interpolated daily NDVI crosses the corresponding threshold upwards . Piao et al., GCB (2006); AFM(2011)
Spring phenology change Spatial patterns of spring vegetation green-up date • The green-up date increases from east to west; • In the most inland part of the plateau, green-up starts by early June • The southwest has the latest green-up dates, typically by the end of June.
Spring phenology change Spring vegetation green-up date vs. altitude • Spatial patterns of spring vegetation green up date closely linked with altitude. • Across the Plateau, in response to increase in elevation by 100m, the green-up date delays by 0.8 days.
Annual Spring Spring phenology change Temperature vs. altitude • Such a significant increase in green-up date with increasing altitude is coincident with decreasing temperature; • Both annual and spring temperature is negatively correlated with altitude by 0.3 and 0.4 oC/100m, respectively.
The vegetation green-up significantly advanced by 0.9 days yr-1 from 1982 to 1999 (R2=0.56, P<0.001); • From 1999 to 2006, the green-up date marginally delayed with an overall rate of 2.2 days yr-1. Eurasia: -0.4 days/yr North America: -0.43 days/yr Spring phenology change
Spring phenology change Temporal change in spring temperature • The different trends in green-up dates before and after 1999 are comparable with the difference of spring temperature change between two periods (1982-1999 vs. 1999-2006). • Spring temperature averaged across all the 50 metrological stations in the Qinghai-Xizang Plateau showed a clear increasing trend during the period 1982-1999, followed up by a decreasing trend from 1999 to 2006 .
Spring phenology change The relationship between temperature at the date of green-up and mean annual temperature across all climate stations • The temperature threshold of green-up is significantly and positively correlated with MAT; • Vegetation in warmer environments requires a higher temperature threshold to green up than in colder areas, because vegetation acclimate to high tempeature.
Spring phenology change Trend in spring phenology and temperature Before 1999 • Vegetation green-up significantly advanced in 29% of vegetated area, particularly in the southwestern parts; • In contrast, during 1999-2006, the green-up date delayed (positive trends) in more than 75% of Qinghai-Xizang Plateau. After 1999
Spring phenology change Green-up trends in relation to elevation Before 1999 • Before 1999, along the elevation gradient, higher advancing rate of spring phenology in the regions with higher elevation; • The phenomenon was reversed during 1999-2006 with higher delaying trend of spring phenology in high elevation, particularly at elevation higher than ≈ 4000 m . After 1999
Outline 1. Change in spring phenology 2. Change in carbon balance
Motivation Total CO2 emissions 10 8 6 CO2 Partitioning (PgC y-1) Atmosphere 4 2 1970 1980 2010 2000 1960 1990 Data: NOAA, CDIAC; Le Quéré et al. 2009, Nature-geoscience
Motivation Fate of Anthropogenic CO2 Emissions (2000-2009) Global Carbon Project 2010; Updated from Le Quéré et al. 2009, Nature Geoscience; Canadell et al. 2007, PNAS
Why do we need C budget estimates for the Tibet grasslands? • Most evidence from forests, and knowleadge on the role of grassland in global carbon cycle is very limted; • Extensive grassland is covered in Tibetan Plateau, with 1.4 × 10⁶ km2, roughly 44% of the total grassland area of China and 6% of the worldwide grassland area ; • A large amount of soil organic carbon (SOC) related to slow decomposition due to low temperature are known to be sensitive under global warming.
Change in carbon balance • The parameterizations of ORCHIDEE were improved and calibrated against multiple time-scale and spatial-scale observations including • Eddy-covariance CO2 fluxes at Haibei alpine meadow site; • Soil temperature collocated with 30 meteorological stations; • Satellite leaf area index (LAI) data; • Soil organic carbon (SOC) density profiles from China’s second national soil survey.
Change in carbon balance Before validation • LAI • GPP • TER • NEE • Ecosystem gross GPP, TER fluxes, and absolutevalues of NEE are all overestimated. Tan et al., GBC (2010)
Change in carbon balance After validation • LAI • GPP • TER • NEE • After calibration, ORCHIDEE can successfully capture the seasonal change of C flux as well as the LAI. Tan et al., GBC (2010)
(b) Change in carbon balance • Spatial patterns of model estimated soil temperature, SOC, and LAI over Tibet grassland are also comparable with the observations. Tan et al., GBC (2010)
Change in carbon balance Biomass and SOC in the Qinghai-Tibetan and the Tibetana • The total biomass C stocks in China’s grassland is about 1.05 Pg C [Piao et al., 2007a], indicating that the Qinghai-Tibetan grasslands alone account for 34% of the whole-country grasslands biomass; • Wu et al. [2003], estimated that the total SOC stock of China’s grasslands is 20-24 Pg C, and Qinghai-Tibetan grasslands contribute about 50-60% . Tan et al., GBC (2010)
Change in carbon balance Change in total GPP, TER, and NEP • Over the last five decades, both GPP and TER of Qinghai-Tibetan grasslands is significantly increased; • But the increasing rate of GPP is larger than that of TER; • Accordingly, NEP of Qinghai-Tibetan grassland also shows a significant increasing trend during the study period, and the magnitude of increase in NEP is only 15% of that in GPP .
Change in carbon balance over the Qinghai-Tibetan grasslands is mainly driven by GPP rather than TER Change in carbon balance Change in carbon balance over the European forests is mainly driven by TER rather than GPP
Change in carbon balance C budget during 1980s-2000s (Tg C/yr) • Since 1980, Qinghai-Tibetan grasslands are modeled to annually take up about 18 Tg of carbon. • This is about 50-75% of the carbon sink over the whole plateau (including other ecosystems such as forest) or about 7-10% of the carbon sink in China.