MOS Scientific Applications
460 likes | 590 Views
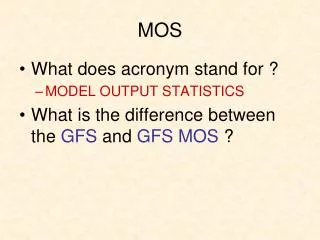
This presentation by Michael Balogh from the University of Durham provides an extensive overview of galaxy clusters and their significance in cosmology. It discusses the Canadian Network for Observational Cosmology (CNOC) and its goal of gathering redshift data from a large sample of luminous clusters. The talk examines the unique environment of clusters that influences star formation rates and the importance of multi-object spectroscopy (MOS) in capturing cluster dynamics and galaxy properties. Future prospects and unanswered questions in understanding galaxy clusters are also highlighted.

MOS Scientific Applications
E N D
Presentation Transcript
MOS Scientific Applications Michael Balogh University of Durham
MOS Scientific Applications(mostly galaxy clusters) Michael Balogh University of Durham
Outline • Galaxy Clusters: scientific motivation • Canadian Network for Observational Cosmology (CNOC) • More clusters and groups with MOS • Ultra-plex spectroscopy: Ha spectroscopy of 4 clusters at z~0.4 • Future considerations
Why clusters? • Very rare objects, in the tail of the mass distribution. So very sensitive to cosmology • Largest structures just virialising today, so we can study the process of structure formation • Extreme environments can affect galaxy properties
150 Mpc/h dalla Vechia, Jenkins & Frenk
Groups Clusters A Press-Schechter plot showing the growth of the mass structure of the universe • LCDM cosmology • Rapid growth of structure Renormalised relative to 1011 M☼
Why Does Star Formation Stop? Cluster environments inhibit star formation (Balogh et al. 1997; 1998) Can the growth in the abundance of clusters explain the global decline of star formation? Or is it related to internal galaxy properties? Steidel et al. 1999
Why MOS? Clusters are ideal targets for MOS because: 1. high density of galaxies 2. close in velocity space, so can use narrow wavelength range to increase multiplex 3. Learn about cluster dynamics and galaxy properties from the same set of spectra
CNOC: Goals Sample: 15 X-ray luminous clusters from EMSS, 0.2<z<0.55 Goal to obtain 50-200 member redshifts per cluster, for a total of ~1500 (r~22) Observations over large fields (~0.5 degree) to sample virialised region Carlberg, Yee, Ellingson 1996 ApJS 102, 269
CNOC: Survey Strategy MOS on CFHT • 4 band-limiting filters to sample rest-frame ~3500Å – 4300 Å, at 4 redshift slices • Obtain ~30 spectra per 9′ field of view; 2-3 masks per field, 1-5 fields per cluster • Real-time operations: • Imaging, mask design, mask cutting, and spectroscopy all done at the telescope Carlberg, Yee, Ellingson 1996 ApJS 102, 269
CNOC: Survey Strategy Carlberg, Yee, Ellingson 1996 ApJS 102, 269
CNOC: Results • Dynamical measurement of Wm • Mass profiles of clusters • Cluster galaxy properties
Dynamical measurement of Wm • From velocity and spatial distribution, determine cluster mass M and virial radius, R • Calculate mass-to-light ratio M/L Carlberg et al. 1996 ApJ 462, 32
Dynamical measurement of Wm • Assume average galaxy M/L is the same in clusters and in the field • Use the field sample from same survey to measure (M/L)crit = rcrit/j, where j is the luminosity density of the Universe • This calculation yields Wm~0.3; the most convincing evidence for low Wm at the time. Carlberg et al. 1996 ApJ 462, 32
CNOC: Average mass profiles Dynamically determined average mass profile of the most massive clusters In good agreement with predictions from simulations (Navarro, Frenk & White 1996) Carlberg et al. 1997 ApJ 478, 462 Carlberg et al. 1997 ApJ 485, L13
CNOC: Galaxy populations Measurements of [OII] emission line for galaxies in clusters and the surrounding field at z~0.3 [OII] closely related to star formation rate (SFR) Showed that average SFR within the virialised regions of clusters is much lower than in lower density regions Balogh et al. 1997, ApJ 488, L75
CNOC: Galaxy populations Showed presence of strong radial gradient in SFR. Always lower than the field Gradient much steeper than expected from morphology-density relation Morph-density relation Field Observed relation Balogh et al. 1998, ApJ 504, L75
CNOC: Galaxy populations Use numerical model of infall to estimate timescale for disruption of SFR Radial gradients in CNOC clusters suggest t ~2 Gyr Balogh, Navarro & Morris 2000
CNOC: Remaining Questions • Are X-ray luminous clusters unusual? • Dust-obscured starburts? Is [OII] a good enough SFR indicator? Are data complete enough to rule out a small fraction of intense, cluster-induced starbursts? • How far does the cluster’s influence extend? • Is star formation sensitive to local effects (i.e. density) or global ones (i.e. clusters vs. groups)
Low Lx Clusters at z~0.25 Cl0841 z=0.24 s=390 Cl0849 z=0.23 s=750 Cl1701 z=0.24 s=590 Cl1702 z=0.22 s=370 Cl0818 z=0.27 s=630 Cl0819 z=0.23 s=340 Cl1309 z=0.29 s=640 Cl1444 z=0.29 s=500 Lx ~ 1043 - 1044 ergs/s, ~ 10 X less massive than CNOC
Low Lx Clusters at z~0.25 Multiobject spectroscopy with MOSCA (Calar Alto) and LDSS2 (WHT) No band-limiting filter, to allow measurement of Ha in some cases
Star Formation in Low-Lx Clusters Spectroscopy for 172 cluster members Mr< -19 (h=1) SFR from [OII] emission line Identical to more massive clusters Balogh et al. 1997 Balogh, et al. 2002, MNRAS 337, 256
300 200 100 0 -100 -200 -300 -200 -100 0 100 200 AC114 (z=0.31) Butcher-Oemler effect? Does star formation take place in clusters at z>0 ? DRA Couch et al. 2001, ApJ 549, 820 DDec
Nod & Shuffle: LDSS++ (AAT) Band-limiting filter + microslit = ~800 galaxies per 7’ field
Nod & Shuffle: LDSS++ (AAT) Advantages: 1. Perfect sky subtraction. Allows observation of Ha at z=0.31 (8600 Å) 2. Short slits = maximum multiplex 3. Trivial data reduction Disadvantages: 1. Lose 2/3 of detector, unless you use an oversized CCD 2. Need √2 more exposure time, unless you nod along the slit
Ha in Rich Clusters at z~0.3 LDSS++ with nod and shuffle sky subtraction, on AAT No evidence for enhanced star formation (Field) Couch et al. 2001 ApJ 549, 820 Balogh et al. 2002 MNRAS, 335, 110
Cluster sphere of influence Fibre based wide field surveys: • 2dF galaxy redshift survey • Ha in 11000 galaxies within 20 Mpc of 17 clusters, down to MB=-19 (Lewis et al. 2002, MNRAS 334, 673) • Sloan digital sky survey • Volume-limited sample of 8600 galaxies from the EDR, MR<-20.5 (Gomez et al. 2003, ApJ 584, 210)
SFR-Environment Relation in the 2dFGRS Lewis et al. 2002 MNRAS 334, 673
The CNOC2 Field survey • Similar strategy to cluster survey, using MOS on CFHT to study field galaxies out to z~0.6 • Yee et al. (2000) ApJS 129, 475 • Main goal to measure evolution of correlation function and star formation rates • Carlberg et al. (2000) ApJ 542, 57 • Lin et al. (1999) ApJ 518, 533
CNOC2 Groups • Identified a sample of groups from original survey (Carlberg et al. 2001 ApJ 552, 427) • Properties of these groups can be directly compared with low redshift counterparts from 2dFgrs and SDSS • Durham involvement: follow-up observations with Magellan to gain higher completeness confirming complete samples of group members using LDSS-2
CNOC2 Groups at z~0.45 LDSS2 on Magellan
CNOC2 Groups at z~0.45 Combined with CNOC2 multicolour photometry and spectroscopy, we can determine group structure, dynamics, stellar mass, and star formation history
[OII] [OII] CNOC2 Groups at z=0.45
[OII] [OII] CNOC2 Groups at z~0.45
CNOC2 Groups at z~0.45 Preliminary results based on only 12 CNOC2 groups Have observed >30 groups to date Balogh et al. 1997
Groups at z > 1 • Deep multicolour (VRi′z′JKs) images of Lynx and Q1335+28 (z=1.2). • Proposals to observe high redshift radio galaxies and radio-loud quasars: known to reside in dense environments • IRIS2 narrow band Ha and [OIII] at z=2.3 • GMOS/FORS2 narrow band filter + grism Ha and [OII] spectroscopy at z=1.4, 1.47, 2.3
Lynx clusters: z=1.2 Subaru VRi’z’ INGRID JKs Identified 7 groups around the clusters from photometric redshifts. GMOS spectroscopy pending Y (arcmin) Nakata et al. (2002) X (arcmin)
Overdensities around HizRG z=1.44 z=1.59 Best et al. 2003
Conclusions • Clusters and groups have a large impact on galaxy star formation rates at the present day • Need to understand how cluster populations evolve to disentangle internal and external effects • MOS at high redshift essential. Nod-and-shuffle required to work at red wavelengths, but need full field of view.