Download

1 / 21
210 likes | 351 Views
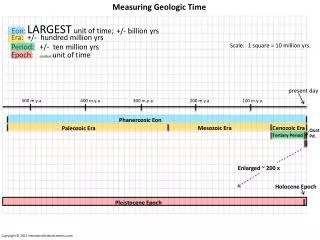
Measuring VET participation by SES over time. Tom Karmel and Patrick Lim CEET conference, 1 November 2013. SEIFA. Index of relative socio-economic disadvantage (IRSD) Index of relative socio-economic advantage and disadvantage (IRSAD) Index of education and occupation (IEO)

E N D
Measuring VET participation by SES over time Tom Karmel and Patrick Lim CEET conference, 1 November 2013
SEIFA • Index of relative socio-economic disadvantage (IRSD) • Index of relative socio-economic advantage and disadvantage (IRSAD) • Index of education and occupation (IEO) • Index of economic resources (IER)
Apparent and actual educational participation rates in a hypothetical example .
15-19 year old VET participation rates, 2006 and 2011, POA
15-19 years VET participation rate, changes between 2006 and 2011, POA
Actual and apparent changes in VET participation for age by SES quintiles, 2006-2011, SEIFA (ISRD), POA (percentage points)
15-19 years VET participation rate, changes between 2006 and 2011, SLA
Apparent and actual VET participation rates for those aged 15-19 years, by SES quintile, 2011
Apparent and actual VET participation rates for those aged 20-24 years, by SES quintile, 2011
Apparent and actual VET participation rates for those aged 24-64 years, by SES quintile, 2011
Actual and apparent changes in VET participation for age by SES quintiles, 2006-2011, SEIFA (ISRD), SLA (percentage points)
More work to be done • Same exercise for higher education • Figure out how to analyse accuracy of estimates at qualification level
Summary • Quintiles ain’t quintiles. • Important to calculate participation rates rather than use 20% as a reference. • Equity issue in VET not obvious. • In respect of SEIFA, level of regional classification matters. • SEIFA at SLA level seems ok, but need to test methodology every census.