Download
1 / 59
590 likes | 942 Views
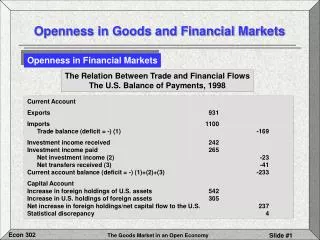
Openness in Goods and Financial Markets. Openness in Financial Markets. The Relation Between Trade and Financial Flows The U.S. Balance of Payments, 1998. Current Account Exports 931 Imports 1100 Trade balance (deficit = -) (1) -169

E N D
Openness in Goods and Financial Markets Openness in Financial Markets The Relation Between Trade and Financial FlowsThe U.S. Balance of Payments, 1998 Current Account Exports 931 Imports 1100 Trade balance (deficit = -) (1) -169 Investment income received 242Investment income paid 265 Net investment income (2) -23 Net transfers received (3) -41Current account balance (deficit = -) (1)+(2)+(3) -233 Capital AccountIncrease in foreign holdings of U.S. assets 542Increase in U.S. holdings of foreign assets 305Net increase in foreign holdings/net capital flow to the U.S. 237Statistical discrepancy 4
1. 2. Trade in Goods and Services * Exports: Payments from the rest of the world ($931 Billion) * Imports: Payments to the rest of the world ($1,100 Billion) Investment Income * U.S. residents receive income on their holdings of foreign assets ($242 Billion) * Foreign residents receive income on their holdings of U.S. assets ($265 Billion) Openness in Goods and Financial Markets Openness in Financial Markets The Balance of Payments The Current Account (Above the Line) All recorded payments to and from the rest of the world
3. 4. Foreign Aid (-$41 Billion) * Net transfers received The difference between foreign aid received and given Current account balance (+,-)= 1+2+3= -$233 Billion (1998) Openness in Goods and Financial Markets Openness in Financial Markets The Balance of Payments (Continued) The Current Account (Above the Line) All recorded payments to and from the rest of the world
1. 2. 3. Increase in foreign holdings of U.S. assets ($542 Billion) Increase in U.S. holdings of foreign assets ($305 Billion) Net capital flows = 1-2 ($542 Billion - $305 Billion = -237 Billion) Openness in Goods and Financial Markets Openness in Financial Markets The Balance of Payments The Capital Account Statistical discrepancy: Accounts for differences in data sources.
Openness in Goods and Financial Markets Openness in Financial Markets The Balance of Payments • The Current Account Balance (+,-) = Capital Account Balance (+,-) • A Current Account Deficit increases foreign holdings of U.S. assets and vice versa.
Openness in Goods and Financial Markets Openness in Financial Markets The Choice Between Domestic and Foreign Assets An Example: Choose between U.S. and German 1 yr. bonds • US Bonds • it = U.S. nominal interest rate • (1+it) = Return next year /$purchase of U.S. bonds
Year t+1 Year t $1 $(1+it) U.S. bonds German bonds Openness in Goods and Financial Markets Openness in Financial Markets Expected Returns from Holding One-Year U.S. or German Bonds
U.S. BondReturn German BondReturn = Openness in Goods and Financial Markets Openness in Financial Markets The Choice Between Domestic and Foreign Assets If: Investors will hold only the asset with the highest rate of return. Then: To hold both U.S. and German bonds, they must have the same return. Or:
The Interest Parity Condition: U.S. BondReturn German BondReturn = Openness in Goods and Financial Markets Openness in Financial Markets The Choice Between Domestic and Foreign Assets (Continued) A little reorganizing:
Observation: The interest parity condition is a good approximation fordeveloped countries with open, well-organized financialmarkets. Openness in Goods and Financial Markets Openness in Financial Markets The Choice Between Domestic and Foreign Assets Is the assumption that investors hold only assets with thehighest expected return realistic? Some other considerations:-- Transaction Costs-- Exchange Rate Risk
Or: = Expected rate of depreciation of the domestic currency The Interest Parity Condition: Openness in Goods and Financial Markets Openness in Financial Markets The Choice Between Domestic and Foreign Assets Adjusting the interest rate parity condition for changes in thevalue of the domestic currency
Openness in Goods in Financial Markets Openness in Financial Markets The Choice Between Domestic and Foreign Assets (Continued) An approximation:
Openness in Goods and Financial Markets Some Conclusions Goods • Openness allows choice between domestic goods and foreign goods. • Which goods are chosen depends primarily on the exchange rate. Financial Assets • Openness allows choice between domestic and foreign assets. • Which assets are chosen depends primarily on: • Relative rates of return • Expected rate of depreciation of the domestic currency
The Goods Market in an Open Economy Expanding the Goods Market Model (IS) to address these questions • Can a foreign expansion stimulate domestic economic growth? • Should macroeconomic policies be coordinated between countries?
The IS Relation in the Open Economy The Open Economy Demand for Domestic Goods... Z C + I + G - Q + X Q: The value of imports in terms of domestic goods X: Exports
The Determinants of C, I, & G Domestic Demand: C + I + G = C(Y-T) + I(Y,r) + G ( + ) (+,-) The Determinants of Imports Imports: Q = Q(Y, ) (+ , - ) The Determinants of Exports Exports: X = X(Y*, ) (+ , +) The IS Relation in the Open Economy The Determinants of the Demand for Domestic Goods
DD DD AA Demand Demand Domestic demand (C + I + G) Imports ( Q) Output Output Observations • Difference between DD & AA increases with income • AA is flatter than DD • AA has a positive slope The IS Relation in the Open Economy The Open Economy Graphically
Net Exports (NX) = X - Q DD ZZ Y < YTB Trade surplus AA Demand Net exports, NX C Exports (X) 0 B YTB Y BC: Net Exports (X – Q) NX A AC: Exports Y > YTB Trade deficit BC AB: Imports YTB Y Output Output, Y The IS Relation in the Open Economy The Open Economy Graphically Demand for Domestic Goods Including Exports (ZZ)
DomesticOutput Demand forDomestic Goods = The IS Relation in the Open Economy Equilibrium Output and the Trade Balance Goods Market Equilibrium: Y = Z Y = C(Y-T) + I(Y,r) + G - Q(Y, ) + X(Y*, )
ZZ Net exports, NX Trade deficit A Demand, Z B Z 0 Y YTB C NX Equilibrium Y = Z Y Output Output, Y The IS Relation in the Open Economy Equilibrium Output and the Trade Balance
ZZ´ (G > 0) A´ Initial equilibrium Y = YTB ZZ Net exports, NX Trade deficit BC@Y’ A G > 0 Demand, Z B New Equilibrium (Y > G) 0 Y YTB C NX Initial equilibrium Output Y Y´ Output, Y The IS Relation in the Open Economy Increases in Demand, Domestic or Foreign Increases in Domestic Demand • Assume G is increased to increase domestic demand & Y
The IS Relation in the Open Economy Increases in Demand, Domestic or Foreign The Impact of Increasing G in an Open Economy Some Observations • A trade deficit is created • The multiplier is smaller Question: How are the trade deficit and the smaller multiplier related?
The IS Relation in the Open Economy Increases in Demand, Domestic or Foreign The Impact of Increasing G in an Open Economy Observation: The more open an economy, the smaller the impactof a change in domestic demand on output. Example: Belgium: Ratio of imports to GDP is 70%. Therefore, 70% of an increase in domestic demand will go for imports. U.S.: Import ratio = 13% Even in the U.S. domestic policy is reduced by the open economy.
A: Initial equilibrium & balanced trade DD Y*: Increases & X NX ZZ´ A´ ZZ C X A X Demand, Z NX 0 Y Demand for domestic goods Y´ YTB NX´ Domestic demand Net exports, NX NX D Output, Y Y Y´ Output The IS Relation in the Open Economy Increases in Demand, Domestic or Foreign Increases in Foreign Demand A´: New equilibrium
The IS Relation in the Open Economy Increases in Demand, Domestic or Foreign Increases in Foreign Demand A Summary • Increase in Y* increases demand for domestic goods, exports grow and equilibrium Y increases. • The increase in Y increases imports. The increase in imports is less than the growth in exports.
1. 2. Increase in domestic demand leads to an increase inY and a trade deficit. Increase in foreign demand leads to an increase inY and a trade surplus. The IS Relation in the Open Economy Increases in Demand, Domestic or Foreign Two Observations:
Recall: Real Exchange Rate: Assuming ConstantPrices: E: Nominal exchange rateP*: Foreign price levelP: Domestic price level The depreciation of a currency ($) will makethat country’s goods cheaper in other countries and vice versa. The IS Relation in the Open Economy Depreciation, the Trade Balance, and Output The Depreciation of a Currency ($)
Q increases 1. 2. 3. X increases Q decreases The IS Relation in the Open Economy Depreciation, the Trade Balance, and Output Depreciation and the Trade Balance: The Marshall-LernerCondition Net Exports: NX X - QNX = X(Y*, ) - Q(Y, ) Depreciation (increase in ) affects the trade balance in three ways: The Marshall-Lerner Condition: For depreciation to improve thetrade balance--the increase in X and decrease in Q is greaterthan the increase in Q.
1. 2. 3. 4. Shift demand, both foreign and domestic toward domestic goods Net exports increase (Marshall-Lerner) Equilibrium Y increases Trade balance improves The IS Relation in the Open Economy Depreciation, the Trade Balance, and Output The Effects of a Depreciation Tracing a Depreciation Through the Economy
Depreciation shifts ZZ to ZZ´ & Y to Y´ Depreciation shifts NX to NX´ & balanced trade ZZ´ A´ Reduction in G shifts ZZ´ to ZZ & Y G ZZ NX A B Demand, Z NX 0 Y Initial equilibrium NX´ C Net exports, NX NX Output, Y Y Output Y´ The IS Relation in the Open Economy Depreciation, the Trade Balance, and Output Combining Exchange Rate and Fiscal Policies Objective: Reduce the trade deficit without changing YPolicy: Balance depreciation and fiscal constraint
Exchange Rate and Fiscal Policy Combinations Initial Conditions Trade Surplus Trade Deficit Low output ? G G? High output G? ? G The IS Relation in the Open Economy Depreciation, the Trade Balance, and Output Combining Exchange Rate and Fiscal Policies
+ Depreciation Time 0 0 Net exports, NX C A B _ The IS Relation in the Open Economy Looking at Dynamics: The J-Curve
The IS Relation in the Open Economy The Real Exchange Rate and the Ratio of Net Exports to GDP: U.S., 1980-1990
1. 2. Movements real exchange rates were reflected in parallelmovements in net exports. There were substantial lags in the response of the trade balanceto changes in the real exchange rate. The J-Curve at work. The IS Relation in the Open Economy Looking at Dynamics - The J-Curve The U.S. - 1980-1990
Y = C + I + G - Q + X and S = Y - C + T Recall: TradeBalance - = Saving Investment The IS Relation in the Open Economy Saving, Investment, and Trade Deficits Subtract C + T from both sides: S = I + G - T - Q + X And using NX X - Q NX = S + (T - G) - I
The IS Relation in the Open Economy Saving, Investment, and Trade Deficits NX = S + (T-G) - I Observations: • Trade surplus: Excess of saving over investment • Trade deficit: Excess of investment over saving • An increase in investment must be reflected either in an increase in private or public saving or in a deterioration of the trade balance. • An increase in the budget deficit must be reflected in an increase in private saving, decrease in investment, or a deterioration of the trade balance. • A country with a high saving rate, public and private, must have a high investment rate or a large trade surplus.
The IS Relation in the Open Economy Increases in Demand, Domestic or Foreign Games that Countries Play A Scenario... • There is a group of countries that are trading partners. • The countries are in a recession • The countries have balanced trade Questions: Why would any one country be reluctant to expand domesticdemand? What would be the impact on the trade balance if all countriesincreased domestic demand together?
Coordination: The Evidence: As global commerce expands, the motivation forcoordination increases. For example, the G7 meetings. There is very little limited macro-coordination. Barriers toCoordination: • Not all countries experience the same economic conditions. • Budget and trade balances may differ. • Countries have an incentive to promise and then not deliver on the promise. The IS Relation in the Open Economy Increases in Demand, Domestic or Foreign Games that Countries Play
Observation: Equilibrium Y & Demand depend on the… real interest rate (r) real exchange rate () r I Demand Multiplier Y Demand for Domestic Goods Demand Y Output, the Interest Rate, and the Exchange Rate Equilibrium in the Goods Market (IS) Output - Demand for Domestic Goods Y = C(Y-T) + I(Y,r) + G - Q(Y, ) + X(Y*, ) ( + ) (+,-) (+, -) (+ , +) Net Exports = X - Q NX(Y,Y*, ) X(Y*, ) - Q(Y,G) Y = C(Y-T) + I(Y,r) + G + NX(Y,Y*, )
Output, the Interest Rate, and the Exchange Rate Equilibrium in the Goods Market (IS) Some Assumptions • The domestic price level is given (e = O & r = i) • The foreign price level is given ( & E move together) P*/P = I & = E New Equilibrium Statement Y = C(Y-T) + I(Y,i) + G + NX(Y,Y*, E) ( + ) (+,-) (- , + , + )
YL(i) = Output, the Interest Rate, and the Exchange Rate Equilibrium in the Financial Markets Money vs. Bonds Money: Equilibrium in the money market in an open economy Supply of money = Demand for money
Domestici Foreigni ExpectedDepreciation = + Output, the Interest Rate, and the Exchange Rate Equilibrium in the Financial Markets Money vs. Bonds Domestic Bonds vs. Foreign Bonds Equilibrium in domestic bonds and foreign bonds Interest parity relation:
Assume: Then: Solving for E: Output, the Interest Rate, and the Exchange Rate Equilibrium in the Financial Markets Money vs. Bonds Domestic Bonds vs. Foreign Bonds (Continued) Equilibrium in domestic bonds and foreign bonds
Interpreting: Output, the Interest Rate, and the Exchange Rate Equilibrium in the Financial Markets Domestic Bonds vs. Foreign Bonds iExchange Rate (appreciation of domestic currency) i* Exchange Rate (depreciation of domestic currency)
Output, the Interest Rate, and the Exchange Rate Equilibrium in the Financial Markets Domestic Bonds vs. Foreign Bonds An example: The adjustment of exchange markets to an increase in U.S. interest rates above German rates • Initially: i = i* & E=Ee • U.S. monetary contraction increases i, if E is constant U.S. bonds become more attractive i > i* • To buy U.S. bonds, Germans must sell German bonds for DM, then sell DM for $s and the $ appreciates. To maintain equilibrium: • the $ appreciation until the expected future depreciation compensates for the increase in i
In terms of Output, the Interest Rate, and the Exchange Rate Equilibrium in the Financial Markets Domestic Bonds vs. Foreign Bonds A numeric example: Assume: U.S. i & Di* = 4% • Then U.S. i increases to 10% • The $ will appreciate 6% • At a 6% appreciation, holding U.S. or German bonds yields 10% in $s 10% = 4% + 6%
Interest Rate: Exchange Rate: Output, the Interest Rate, and the Exchange Rate Putting Goods and Financial Markets Together The goods market equilibrium depends, in part, on i & E Output: Y = C(Y-T) + I(Y,i) + G + NX(Y,Y*,E) The money market determines i The interest parity condition implies i & E are negatively related.
Equilibrium in Financial Markets The Relation Between the Interest Rate and the Exchange Rate Implied by Interest Parity A lower domestic interest rate leads to a higher exchange rate—to a depreciation of the domestic currency. A higher domestic interest rate leads to a lower exchange rate—to an appreciation of the domestic currency.
Output, the Interest Rate, and the Exchange Rate Putting Goods and Financial Markets Together The goods market equilibrium depends, in part, on i & E (Continued) The Open-Economy IS-LM Model
Consider: Output, the Interest Rate, and the Exchange Rate Putting Goods and Financial Markets Together • If i increases: • Direct Effect: I Y • Indirect Effect: Domestic Currency Appreciates NXY In an open economy is the multiplier larger or smaller?