Download
1 / 34
340 likes | 588 Views
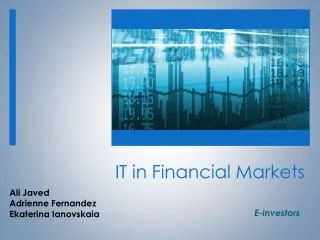
IT in IT in Financial Markets IT in Financial Markets IT in Financial Markets. E-investors. Ali Javed Adrienne Fernandez Ekaterina Ianovskaia. Agenda. Top-down approach to security analysis First portfolio vs. last portfolio Tools used Surprise 1 Surprise 2 Neural Networks

E N D
IT in IT in Financial MarketsIT in Financial MarketsIT in Financial Markets E-investors Ali Javed Adrienne Fernandez Ekaterina Ianovskaia
Agenda • Top-down approach to security analysis • First portfolio vs. last portfolio • Tools used • Surprise 1 • Surprise 2 • Neural Networks • Challenges and risk mitigation • Lessons learned
Introduction • Modern Portfolio Theory • Don’t put all your eggs in the same basket! • use of diversification strategy • diversify across industries and companies • choose large market capitalization stocks • Avoid risks
Step 1: Economic Analysis • Research and data mining: • Online • Offline • TV • Newspapers • discussions with professors • Popularity hypothesis by Keynes: Find what stocks will be popular among other investors • Community based social investing websites like Zecco • Findings: • High economic instability • Don’t invest in Japan • U.S. low dollar stimulates exports and economic growth
Step 2: Industry Analysis Fidelity.com Historical trends show that the most performing current industries are: Information Technology Financials Energy Industrials Health care Consumer Services
Step 3: Fundamental Analysis Teamwork: Search different websites, use Google docs to post findings Technical analysis: look at stock patterns and analyzing the potential of growth of these stocks. Choose many stocks performing better than the benchmark S&P500 over the past To diversify some of the risk, choose several stocks with more steady returns, which are far less volatile High earnings per share Mixed high and low betas
Tools used CompuStat CRSP Data mining, stock charts CAPM Matlab Most useful tool: Excel solver
Excel Solver: Step by step • Step 1: Define what we need to find: • maximum return • minimum variance • Step 2: Prepare the Spreadsheet • Data and Constraints • Step 3: Solve the model with the Solver • Find optimal portfolio
Covariance matrix Best Portfolio: diversified
Surprise 1-Mad Money • Followed recommendations • Chose stocks according to our analysis • Diversification: • According to days of recommendation • Outcome: positive!
Surprise 1-Mad MoneyOutcome SKS : Monthly MCD : Monthly ORCL : Monthly SKS : Daily MCD : Daily ORCL : Daily
Surprise 2 - Vice vs Virtue Virtue Companies: AGP (Amerigroup Corp) WBS (Webster Financial Corp) PLL (Pall Corp) Vice Companies: WMT (Wal-Mart Stores Inc) NOC (Northrop Grumman Corp) KBR (KBR Inc)
Surprise 2 - Vice vs Virtue Outcome AGP: -$4,395.47 WBS: +$487.20 PLL: +$2,844.60 WMT: +$2,740.75 NOC: -$1,143.84 KBR: -$1,255.68
Surprise 2 - Vice vs Virtue Outcome Vice: Virtue:
Neural Networks Trial version : Limited number of inputs
Neural Networks in stock price forecast WBS Data: 250 observations (1 year period) of WBS daily stock prices and market indicators from Compustat Indicators: Fundamental: Returns, Volume Technical: Moving averages (30) (90) Market Index: S&P 500
Neural Networks Result WBS 50-50-50 rule
Neural Networks Result WBS Predicted Volatility well, but not magnitude of changes and price level
Neural Networks Result AGP Predicted Price Level better, not Volatility. Reason: Input Factors
Neural Networks Result • Not all factors that affect one stock affect the other • Bank Prime Loan Rate • Sensitivity To The Market
Event Analysis We did Event Analysis using Eventus Walmart dividend increase announcement for April 1st Assuming markets are efficient or semi-efficient Traders can react to news faster than we can. Was not useful in picking stocks
Challenges and risk mitigation Difficulty to use some portfolio analysis tools (Matlab) Difficulty to understand tools (Neuro Solutions) Selling Stocks (Glitches, time limit) Availability issues for our team (Google)
Lessons learned New stock portfolio investment tools Never use one tool in isolation Market is quicker than we are Instinct Vs Hope Timing is Key Market Efficiency? Eventus Vs Mad Money Detailed Analysis = Computer Power
Thank you ! Questions