Download

1 / 28
340 likes | 789 Views
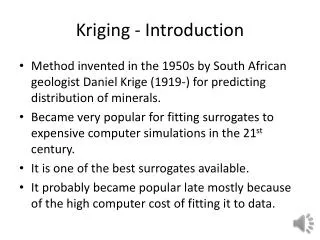
July 14, 2011. Concepts and Applications of Kriging . Konstantin Krivoruchko Eric Krause. Outline. Basics of geostatistical interpolation Exploratory spatial data analysis (ESDA) Choosing a kriging model Validating interpolation results What’s new in 10.1? Questions and answers.

E N D
July 14, 2011 Concepts and Applications of Kriging Konstantin Krivoruchko Eric Krause
Outline Basics of geostatistical interpolation Exploratory spatial data analysis (ESDA) Choosing a kriging model Validating interpolation results What’s new in 10.1? Questions and answers
Terminology kriging, cokriging, universal kriging, disjunctive kriging, indicator kriging, covariance, semivariogram, nugget, change of support, intrinsic hypothesis, second order stationarity, weighted least square, Gaussian simulation, linear mixed model, maximum likelihood … nugget A parameter of a covariance or semivariogram model that represents independent error, measurement error, and microscale data variation. The nugget effect is seen on the graph as a discontinuity at the origin of either the covariance or semivariogram model.
Geostatistical Interpolation • Predict values at unknown locations using values at measured locations • Many interpolation methods: kriging, IDW, LPI, etc
What is autocorrelation? Tobler’s first law of geography: "Everything is related to everything else, but near things are more related than distant things."
Wizard Demo Konstantin Krivoruchko
What is kriging? • Kriging is the optimal interpolation method if the data meets certain conditions. • What are those conditions? • Normally distributed • Stationary • No clusters • No trends • How do I check these conditions? • ESDA
Geostatistical workflow • Explore the data • Choose an interpolation method • Validate the results • Repeat steps 1-3 as necessary • Map the data for decision-making
Exploratory Spatial Data Analysis • Where is the data located? • What are the values at the data points? • How does the location of a point relate to its value?
Does my data follow a normal distribution? • How do I check? • Histogram • Check for bell-shaped distribution • Look for outliers • Normal QQPlot • Check if data follows 1:1 line • What can I do if my data is not normally distributed? • Apply a transformation • Log, Box Cox, Arcsin, Normal Score Transformation
Does my data follow a normal distribution? • What should I look for? • Bell-shaped • No outliers • Mean ≈ Median • Skewness ≈ 0 • Kurtosis ≈ 3
Does my data follow a normal distribution? Logarithmic Transformation
Normal Score Transformation • Available with the Geostatistical Wizard • Fits a mixture of normal distributions to the data • Performs a quantile transformation to the normal distribution • Performs calculations with transformed data, then transforms back at the end • Back transformation is done automatically
Is my data stationary? • What is stationarity? • The spatial relationship between two points depends only on the distance between them. • The variance of the data is constant (after trends have been removed) • How do I check for stationarity? • Voronoi Map symbolized by Entropy or Standard Deviation • What can I do if my data is nonstationary? • Transformations can sometimes stabilize variances • Empirical Bayesian Kriging – Available is ArcGIS 10.1
Is my data stationary? • When symbolized by Entropy or StDev, look for randomness is the classified Thiessen Polygons.
Does my data have clusters? • Clusters of data points will give too much emphasis to points within clusters. • When looking for nearest five neighbors, all neighbors may be in the same cluster. • Solution: Cell declustering • Points are averaged within each cell • Weights assigned to cells by number of points in the cell
Does my data have trends? • What are trends? • Trends are systematic changes in the mean of the data values across the area of interest. • How do I check for trends? • Trend Analysis ESDA tool • What can I do if my data has trends? • Use trend removal options • Potential problems – Trends are often indistinguishable from autocorrelation and anisotropy
ESDA Demo Konstantin Krivoruchko
Cross-validation • How good is the model? • Iteratively discard each sample • Use remaining samples and kriging model to estimate sample value at known location • Compare true vs. estimated • Validation • How good are the predictions? • Exclude subset of samples from the interpolation • Compare predictions to that subset Model diagnostic
Geostatistical Analyst provides a variety of output surface types for accurately representing the phenomena in question Prediction Quantile Error of Predictions Probability Kriging output surface types
What’s new in 10.1 beta? Empirical Bayesian Kriging Requires minimal interaction Works for moderately nonstationary data Areal Interpolation Kriging for polygonal data, works with counts and proportions Cast polygonal data from one geometry to another Counties to postal codes New normal score transformation Multiplicative Skewing
Please fill out the questionnairehttp://www.esri.com/sessionevals
Presentation of interest • Time: Today 01:30 PM - 02:45 PM : • Title: ArcGIS Geostatistical Analyst - An Introduction • Location: Room 14 A