Download
1 / 35
350 likes | 527 Views
The Need for and Feasibility of a Global Lightning Detection Network. Frederick R. Mosher NWS/NCEP Aviation Weather Center. Potential Users of Global Convection Information. Aviation (safety and routing)

E N D
The Need for and Feasibility of a Global Lightning Detection Network Frederick R. Mosher NWS/NCEP Aviation Weather Center
Potential Users of Global Convection Information • Aviation (safety and routing) • Initialization of Numerical Models (storms in right places; redistribution of energy and mass) • Precipitation Monitoring (hydrology, agriculture) • General Circulation and Climate Studies (redistribution of mass and energy)
SIGMETs • A SIGMET (SIGnificant METeorological Information) advises of weather potentially hazardous to all aircraft. Hazards covered are: • Significant convection • Severe icing • Severe or extreme turbulence • Duststorms and sandstorms lowering visibilities to less than three statute miles • Volcanic Ash
Convective Hazard Detection • Geostationary satellite infrared images traditionally used to monitor convection over the oceans. • Experimental Vaisala Long Range Lightning Detection Network used to supplement satellite images within 2000-3000 km of US/Canada.
Methods for Geostationary Monitoring of Convection • Infrared Temperature of Clouds • Multi-channel feature identification • Channel differences (GCD)
GCD Identification of Updrafts • For deep convective clouds, updraft brings cloud particles and water vapor to top of cloud. (IR and Water Vapor temperature are the same) • Clouds drifting away from lift will allow cloud particles to fall. Water Vapor will remain at original level. (IR and WV temperatures will be different)
GCD Thunderstorm Detection Tir=Twv Tir>Twv
Algorithm Processing • IR-Water Vapor temperatures differences in original satellite projections. • Temperature differences mapped into 10 km global latlon equidistance projection with parallax correction for 10 km high cloud. • Data limited to within 65 degrees of satellite subpoint. • Most timely data on top for data overlaps.
Algorithm Processing (cont) • Temperature difference of 1 degree or less are considered convective. • Lifted index (from AVN) of +1 or less used to eliminate any detection from non convective clouds (such as cirrus from ageostrophic lifting).
GCD Verification • National Convective Weather Diagnostic (NCWD) used as ground truth • NCWD generated from radar and lightning data over the US (see http://cdm.aviationweather.noaa.gov/ncwf/ for real time NCWD) • Verification done using FSL Real Time Verification System (RTVS). • http://www-ad.fsl.noaa.gov/fvb/rtvs/conv/index.html
Verification Summary • GCD PODy=.44 • GCD PODn=.99 • GCD Bias=2.78 • For comparison: • Conv. SIGMET PODy=.44 (0 hr) • Conv. SIGMET PODn=.99 • Conv. SIGMET BIAS=1.39
FAA Sponsored Ocean Weather Product Development Team (PDT) • Focus on techniques for detecting and forecasting convective hazards to aircraft over the oceans. • Several different satellite techniques have been developed and intercomparison efforts are attempting to determine the strengths and weaknesses of each method.
Utilization of NASA TRMM Satellite Information to Evaluate OW Algorithm Products Lightning Imaging Sensor (LIS) not shown
Observations of TRMM PR data thundercloud profile cumulonimbus cloud profile
Summary of 1st Inter-comparison • Distinctions made between thunderstorms and cumulonimbus clouds using TRMM LIS data • Satellite products perform well at identifying both types of clouds but unable to make distinctions between the two
2nd Inter-comparison: 26-31 March 2003 Pacific sector 20N – 0N, 150W – 120W (area: 6.94x10⁶ km2) 21:00 – 03:00 UTC South American sector 10N – 20S, 80W – 50W (area: 10.91x10⁶ km2) 18:00 – 00:00 UTC • Sectors selected based on high likelihood of air mass thunderstorms over land and deep convection in ITCZ • Analysis performed during TRMM intersects – Pacific (14) South America (8)
Overall Assessment of Inter-comparisons • In terms of satellite product performance: • All perform well at identifying continental convection but exaggerate presence of maritime convection • All perform well at identifying the clouds posing the greatest hazard to aviation, i.e. thunderstorms • NRL cloud class more responsive at detecting convective cells in early developmental stage • False alarm/hit ratios are dramatically higher over ocean vs. land • Reflectivity profiles of oceanic events indicate that most are weakly developed in the mixed phase region
Implications of Intercomparisons • Satellites image techniques can not distinguish between hazardous thunderstorms and non hazardous convective clouds. • Lightning detection data is needed to identify thunderstorm hazards over the oceans.
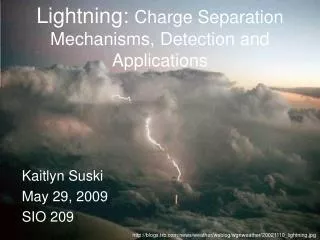
Thunderstorms Require Charge Separation • Thunderstorm charge separation typically requires existence of graupel. • Graupel formation requires an updraft speed of 7-10 m/sec. • Thunderstorm Project observed aircraft severe turbulence for updrafts > 10m/sec • Existence of lightning can be used distinguish convective updrafts >7-10m/sec.
Long Range Lightning Detection Vaisala VLF/LF sensors (IMPACT and LPATS) are very responsive to ionospherically-propagated electromagnetic signals, in the VLF frequency range. Thus, they are able to detect remote lightning events that occur at great distances. During the daytime, the long-range lightning data is generally available out to 1200-2400 NM (2000-4000 km) from the sensors with a DE of 10-20%. At night the range increases to 2400-4800 NM (4000-8000 km) and the DE to 10-30%.
PacNet Configuration • Employs Five (5) IMPACT ESP Long Range VLF Sensors: • Hawaiian Islands [Kauai and Midway Islands] • Dutch Harbor, Alaska • Kwajalein Atoll • Other Pacific islands • Also Employs Long-Range Data Detected by the: • National Lightning Detection Network • Canadian Lightning Detection Network • Data Processed at Vaisala-GAI Network Control Center-Tucson • Will begin operations early 2004.
Median Detection Efficiency - NALDN + PacNet Projection Based on Long-range Configuration
Median Location Accuracy NALDN + PacNet Projection Based on Long-range Configuration
Global Coverage • 80-100 VLF sensors would be needed for global coverage. • Projected total cost of CARIBNET was $400K/yr for 7 sensor network. • Extrapolated cost of global network would be $5M per year. • Comparable in extend and cost to NLDN for US coverage.
Complimentary data source:NASA Lightning Mapper May Fly on upcoming GOES-R (2012)
Conclusions • Advanced satellite thunderstorm detection algorithms have not been able to demonstrate the ability to distinguish thunderstorms from weaker convection over the oceans. • Lightning data is needed over the oceans to identify thunderstorms hazardous to aviation. • Technology exists that could be utilized for global lightning detection if funding sources could be identified ($5M/yr) .