Download
1 / 7
70 likes | 73 Views
This data analysis examines the prevalence of coronary artery disease and diabetes among new renal replacement therapy (RRT) patients in Australia and New Zealand, as well as age-specific death rates and observed survival times. The study also includes time ratios for survival in individuals over 65 years old, considering various comorbidities.

E N D
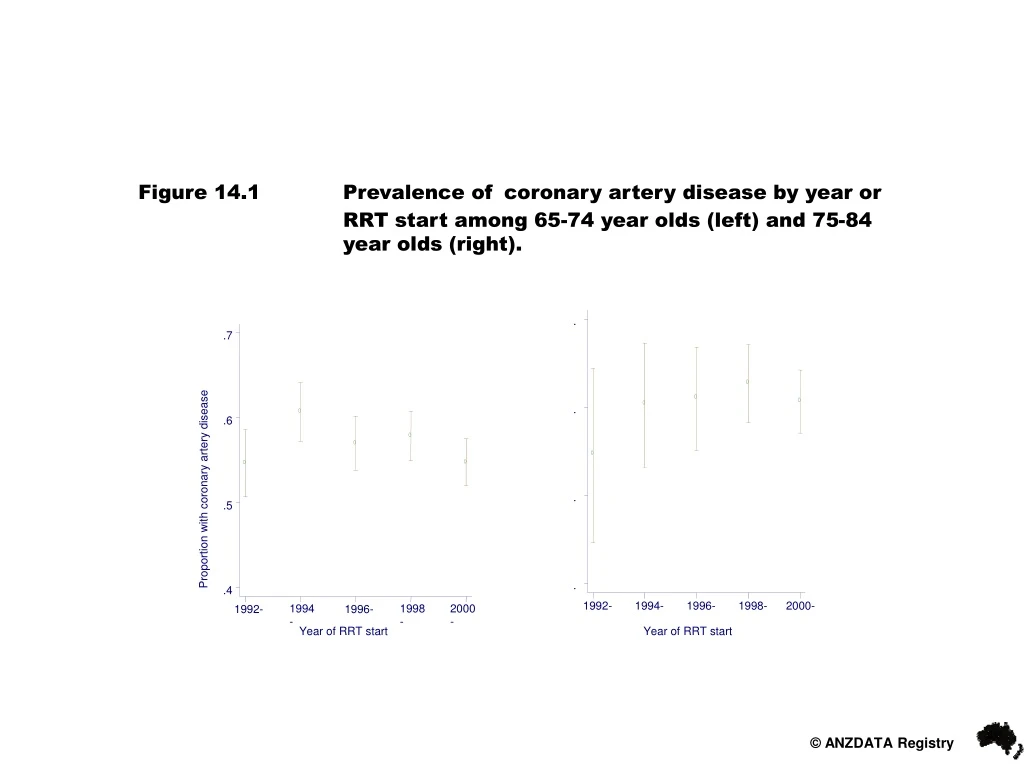
Figure 14.1 Prevalence ofcoronary artery disease by year or RRT start among 65-74 year olds (left) and 75-84 year olds (right).
Figure 14.2 Prevalence of diabetes amongnew RRT patients in Australia and New Zealand, 1992-2002
Table 14.4 Age-specific Death Rates, and Observed Survival Times (25th, 50th and 75th centiles), Integrated RRT for Australia and New Zealand Mortality Observed Cohort Rate Number of Age Group (per 100 Subjects 25% 50% 75% years) 00-14 1.8 322 15-24 1.8 713 25-34 3.3 1464 9.0 35-44 4.8 2163 5.7 45-54 9.3 3240 3.1 7.3 55-64 14.6 4135 2.1 4.6 9.0 65-74 23.1 4570 1.5 3.1 5.5 75-84 31.6 1704 1.1 2.4 3.9 > 85 52.2 63 0.4 1.5 2.6
Figure 14.5 Kaplan-Meier curve of patient survival by age category, integrated across all RRT modalities, for those who started RRT between 1-Apr-1992 and 31-Mar-2002. * = years of age.
Figure 14.6 Predicted 25th, 50th and 75th Centiles of Survival by Age, assuming NO comorbidities Observed Cohort Age Group 25% 50% 75% 65-69 1.8 3.6 6.0 70-74 1.4 2.9 4.9 75-79 1.2 2.5 4.2 80-84 1.0 2.1 3.7 85-89 0.7 1.5 2.6 90 + 0.4 0.8 1.5
Figure 14.7 Time Ratios for Survival in the > 65 Year Age Group These should be multiplied by the median survival in Fig. 14.3 to derive an median expected survival. For a 72 year old female type II diabetic with coronary artery disease, expected median survival would be 3.6 x 0.82 x 0.84 = 2.5 years. Parameter Time Ratio 95% Conf. Interval Type I diabetes 0.62 0.45 0.86 Male gender 1.11 1.03 1.18 Type II diabetes 0.80 0.74 0.87 Aboriginal 0.84 0.66 1.07 Maori / Pac.Isl. 0.80 0.67 0.96 Coronary artery disease 0.79 0.73 0.86 Cerebrovascular disease 0.82 0.76 0.89 Chronic lung disease 0.78 0.72 0.85 Peripheral vascular disease 0.79 0.73 0.86