Download
1 / 27
280 likes | 481 Views
Snow Properties Relation to Runoff. Presentation by Karl Rittger This work is supported by Naval Postgraduate School Award N00244-07-1-113 and NASA Cooperative Agreement NNG04GC52A. Motivation.

E N D
Snow Properties Relation to Runoff Presentation by Karl Rittger This work is supported by Naval Postgraduate School Award N00244-07-1-113 and NASA Cooperative Agreement NNG04GC52A
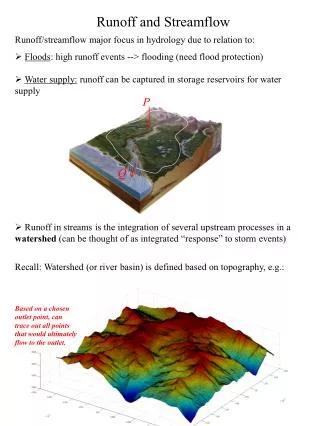
Motivation • In snowmelt dominated river basins, snow properties near peak accumulation are used to assess spring and summer runoff. Forecast models rely on estimates of the water stored in the snowpack to determine the contribution of snowmelt to runoff. • Current operational runoff forecasts (DWR & NWS) assume stationary relationship between sparse point measurements of snow water equivalent and runoff • Spring runoff forecasts use snow course measurements taken near the 1st of each month • Analysis of snow course measurements show non-stationarity ie. trends • Howat and Tulaczyk (2005) find decreasing and increasing SWE trends dependent on both latitude and elevation
Can we improve runoff forecasting by integrating remote sensing sources? • Snow Covered Area • From satellites • MODIS • Daily at 500m • Landsat • Every 16 days at 30m • Snow Water Equivalent • Telemetered pillows • Daily measurements
Spring Runoff in the Sierra Nevada for the last 100 years Based on monthly unimpaired runoff volumes, we selected a set of years during the Landsat TM historical record (1985-2007) that encompass 80% of the range of variability in runoff during the last century. An average family uses 0.25 to 1.0 acre-feet a year
Topographic Characteristics • Elevation • American lower • Kern higher • Aspect • Kern south facing • Slope • Similar • Kern slightly steeper
Spring Runoff for each Watershed We estimate the fraction of snow in each 30 m pixel for the American, San Joaquin and Kern watersheds for five years that represent the minimum, quartiles and maximum April, May, and June unimpaired runoff. Recent years have produced similar variability in runoff, and fractional snow cover is estimated from MODIS for these years at 500 m resolution.
Satellite Spectral Bands Landsat MODIS
Top of Atmosphere Reflectancefor Landsat Lλ = "gain" * QCAL + "offset“ Lλ = ((LMAXλ - LMINλ)/(QCALMAX-QCALMIN)) * (QCAL-QCALMIN) + LMINλ
6S radiative transfer code (http://6s.ltdri.org) • Developed by the Laboratoired'OptiqueAtmospherique. The code permits calculations of near-nadir (down-looking) aircraft observations, elevated surfaces, non lambertian surface conditions, absorbing gases, Rayleigh scattering, and aerosol scattering effects. The spectral resolution is 2.5 nm. • Primarily used for LUTs for MODIS • Kotchenova et al. 2006 • Kotchenova and Vermote 2007 • List of other atmospheric radiative transfer codes
Physical Background • Fraction of photons from target reach satellite sensor. • Typically 80% at 0.85 µm and 50% at 0.45µm • Photons lost though absorption and scattering • Absorption from • Aerosols (small) or atmospheric gasses • Principally O3, H2O, O2, CO2, CH4, N2O • Scattering
Surface Reflectance using 6S Signal perturbed by gaseous absorption and scattering by molecules and aerosols Absorption by atmospheric gases: O3, H2O, O2, CO2,CH4, and N2O
Snow Covered Area fromSpectral Unmixing • Roberts et al, 1998 • Painter et al, 2003
(Roughly?) Estimating SWE for a River Basin • Fassnacht et al, 2003 • Hypsometric Interpolation with inverse weighted distance interpolation of the residuals • Spreads snow into the ocean • Blended SWE • Multiply by SCA
Snow Covered Area totals Landsat MODIS
Snow Water Equivalent totals Kern American San Joaquin Kern American San Joaquin
Conclusion • Although snow water equivalent interpolations are influenced by data availability, when combined with remote sensing it can be useful in predicting stream flow. These techniques can provide water managers with more accurate volumes of water stored in snowpack • Further work will investigate alternative interpolation methods as well as utilize space-time interpolated MODIS snow cover to provide basin SWE estimates over the season