Download
1 / 29
290 likes | 418 Views
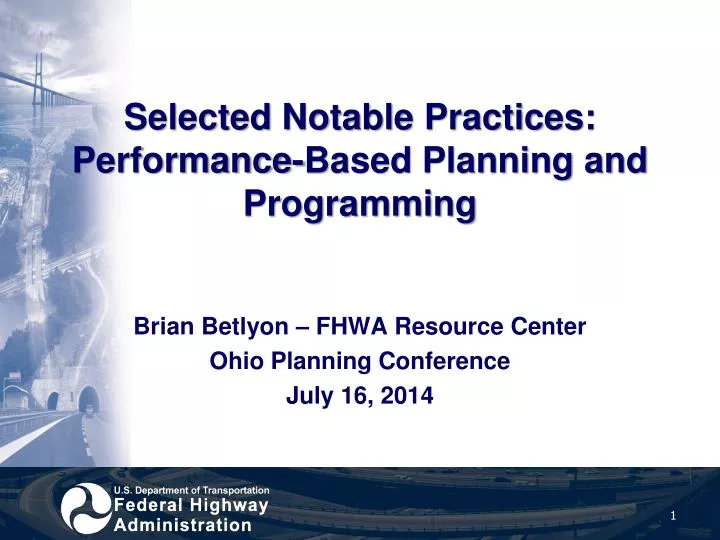
Selected Notable Practices: Performance-Based Planning and Programming. Brian Betlyon – FHWA Resource Center Ohio Planning Conference July 16, 2014. 1. Topics. PBPP Framework Target Setting Resource Allocation MPO practices State DOT practices Transit operator perspective. PLANNING.

E N D
Selected Notable Practices: Performance-Based Planning and Programming Brian Betlyon – FHWA Resource Center Ohio Planning Conference July 16, 2014 1
Topics PBPP Framework • Target Setting • Resource Allocation MPO practices State DOT practices Transit operator perspective
PLANNING Goals and Objectives Develop Investment Priorities Investment Plan Strategic Direction Where do we want to go? Performance Measures Analysis How are we going to get there? Identify Trends and Targets Quality Data and Public Involvement Identify Strategies and Analyze Alternatives Monitoring Evaluation Resource Allocation Reporting Program of Projects Implementation and Evaluation How did we do? Programming What will it take? PERFORMANCE-BASED PLANNING AND PROGRAMMING
METROPOLITAN PLANNING ORGANIZATION Practice Examples
Target Setting Key question – Aspirational or vision-based targets vs. evidence-based targets No single approach appropriate for all areas MAP-21 requires evidence-based targets – what do you expect to achieve Data needs
Champaign Urbana MPO2035 LRTP Measures • Goal #6: To provide facilities for non-auto modes of transportation in order to improve mobility and decrease the number of vehicles on our roadways • Objective 2: Increase local transit ridership by at least 5% by 2014 • Objective 3: Increase the number of enplanements at Willard Airport by at least 10% by 2014 • Objective 4: Increase the number of Amtrak boardings at Illinois Terminal by at least 15% by 2014 • Annual Transit Ridership • Annual Enplanements • Annual Ridership at Illinois Terminal • Number of Transit Routes • Number of Flights • Frequency of Trains per day 6
Mid-Ohio Regional Planning Commission2012-2035 MTP View other MORPC Goals and Objectives: http://morpc.org/pdf/2012MTP_ExecSummary_May.pdf
Maryland State Highway Administration Objectives:FY 2012-2015 Business Plan
Resource Allocation • Resources include investments in infrastructure, staffing decisions, and policy/strategy decisions • Performance-based investment decision making requires an understanding of … • The strategies that are likely to improve performance • The impacts of these strategies on expected performance • Data and tools to be able to measure or estimate these impacts
Example - SEMCOG Examine the relationship between program-level investment and performance 1 • Examine scenarios that vary funding by program area; adopt a preferred scenario • Preservation focused • Transit focused • Public preference driven 2 Pavement Track performance over time; track investments against the adopted scenario 3 Delay Bridge Safety
MTC Performance Assessment to Achieve Congestion Reduction Target Congestion reduction goal
Transit Operator PBPP Perspectives Washington Metropolitan Area Transit Authority
Example – Mn/DOT Multimodal Plan Investment Plans Performance Monitoring Integrates performance planning & risk assessment to establish priorities for projected funding. Measures impact of investments on performance targets. Regular review of performance in each policy area Supports Minnesota GO 50-year vision. Establishes objectives & strategies to guide investment 19
WMATA - The MAP-21 Crossroad You are here Path of Resistance Letter of the Law Common Sense Opportunities
MAP-21: Requires “Performance-Based” Goals/Objectives 2 1 3 Performance Measures QualityData Target Setting Evaluate Programs, Projects & Strategies Measure, Evaluate, and Report Results Actual Performance Achieved Allocate Resources Budget and Staff 5 4 Source: NCHRP 8-36 (Task 104): Integrating Performance Measures into a PBPP Process
Putting PBPP into Practice: Lessons Learned at WMATA Challenges Opportunities Cultural resistance to performance mgmt. Culture change Develop an elevator “pitch” Focus on the Vital few Measure = bacteria PBPP lip service Tendency to fixate only on the number “Trains 92% on-time” Embrace power of “why” • Fleet 66% more reliable • Adjusted track work More lessons learned in TR News Issue on Performance Management (Upcoming, Spring 2014)
MAP-21: Requires Coordination Challenges Opportunities • Learn from others (peer exchange!) • PBPP and data sharing drives coordination • Begin coordinating performance monitoring to identify regional trends • Show how ALREADY coordinating • Establish common ground • Explore collective impact model Silos between agencies/ jurisdictions Fear about “surrendering” control MPOs typically do not own and operate infrastructure, reliant on other agencies to achieve targets Multiple performance efforts occurring Different priorities
MAP-21: Requires Targets Challenges Opportunities • Focus on connection between actions and results • Increase buy-in to the measures • Expose data issues • Highlight where more resources are needed • Manage expectations • Force conversation about why set target Data vs. gut Clarifying audience Gathering data Understanding inputs (e.g., trends, actions, resources, externalities, peers) Publically announce touchdown Different targets across agencies (local vs. state)
MAP-21: Requires Asset Management Plans Challenges Opportunities • Put money where should • State DOTs advancing asset management practices • Learn from our DOT siblings • Evolve FHWA and FTA relationship to agencies Time and resources Incorporating Risk new frontier Transit agencies new to TAMP Unknown impact on funding
MAP-21: Requires Reports Challenges Opportunities • Use existing resources better • Build trust • Understand why • Celebrate successes • Make your case- be innovative Time and resources Report just to report Publically show results- good and bad What will FHWA/FTA do with information?
MAP-21: Requires Reports Opportunity Communicate performance trends to explain challenges AND demonstrate progress Data without context leads to misinterpretation Challenge
Thank You! Brian Betlyon FHWA Resource Center Planning Team brian.betlyon@dot.gov Discussion