Download
1 / 9
90 likes | 174 Views
Explore the latest business trends for August 2010, including key findings on confidence movement, output, optimism, inflation, and employment indices. Gain insights from major business surveys and expert analysis.

E N D
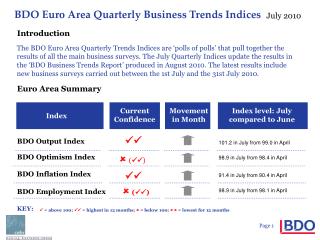
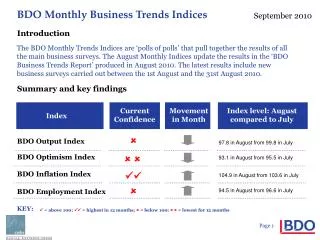
Introduction The BDO Monthly Trends Indices are ‘polls of polls’ that pull together the results of all the main business surveys. The August Monthly Indices update the results in the ‘BDO Business Trends Report’ produced in August 2010. The latest results include new business surveys carried out between the 1st August and the 31st August 2010. Summary and key findings Current Confidence Movement in Month Index level: August compared to July Index BDO Output Index 97.8 in August from 99.8 in July BDO Optimism Index 93.1 in August from 95.5 in July BDO Inflation Index 104.9 in August from 103.6 in July BDO Employment Index 94.5 in August from 96.6 in July KEY: = above 100; = highest in 12 months; = below 100;= lowest for 12 months
Key Findings The key finding in August is the fall in both expectations for growth over the next quarter and in two quarters time. The output index, which measures expectations one quarter ahead, is suggesting that growth may fall further below the long term trend rate of 0.6 per cent quarter-on-quarter. There was a fairly even fall in confidence for the next quarter between small, large, services and manufacturing firms. Growth in Q3 is therefore set to come in far below the 1.2 per cent quarterly growth that was seen in Q2. The optimism index also tumbled in August after a sharp fall in July as well. This is the fifth month in a row in which the optimism index has fallen. The index has now gone below the 95.0 mark, suggesting potential contraction in Q4. The optimism index was driven by a particularly large fall in the manufacturing index, down to 101.7 in August, from 106.0 in July. The services sector index fell by 1.9 points, compared to the 4.3 point fall in the manufacturing sector. This further data suggests that the UK manufacturing sector is cooling after a strong start to 2010. The latest PMI data showed that the manufacturing sector expanded at a significantly slower pace in August relative to the first half of the year.
Further signs of cooling growth in Q3 BDO Output Index, 100 = average trend growth.Greater than 95 = positive growth The BDO output index fell further below average growth levels in August at 97.8, down from 99.8 in July. The index, however, remains above the 95.0 mark which signals that growth in the next quarter will be positive. This adds considerable weight to the view that Q3 growth will be much lower than the 1.2 per cent quarterly growth in Q2. A similar score in September would suggest that Q3 quarter-on-quarter growth would be approximately 0.5 per cent. Source: PMI, Bank of England, CBI and the Office for National Statistics
Major fall in optimism continues BDO Optimism Index, 100 = average trend growth. Greater than 95 = positive growth The BDO output index fell fairly dramatically for the second month in a row. The index reached 93.1 in August from 95.5 in July and 96.9 in June. This is the fourth month of decline and the fourth month in a row in which the index has remained below 100.0 (signaling below long run growth). August is the first time the index has been below 95.0 (suggesting contraction) since July 2009. One month of data should be treated with caution, particularly as the optimism index looks further ahead than the output index. Nonetheless, the data do suggest that output may be extremely sluggish in two quarters time. Indeed, a reading around this level, or below, over the coming months would be indicative of negative growth in Q4 2010. Source: PMI, Bank of England, CBI and the Office for National Statistics
Inflationary pressures continue to rise BDO Inflation Index, 100 = average trend growth.Greater than 95 = positive growth • The BDO inflation index continued to edge up in August to 104.9 from 103.6 in July. • The BDO inflation index measures inflation expectations over the coming quarter. A value above 95.0 indicates positive annual inflation, while above 100 suggests above long term average trend of 2.0 per cent. • The official statistics showed that the annual rate of inflation in the United Kingdom was 3.1 per cent in July, down from 3.2 per cent in June. • The governor of the Bank of England now expects annual inflation to remain around 3.0 per cent for the remainder of 2010. • This view is supported by the BDO inflation index as it points towards annual inflation over 2.0 per cent over the next quarter. Source: PMI, Bank of England, CBI and the Office for National Statistics
Job creation still extremely low BDO Employment Index, 100 = average trend growth. Greater than 95 = positive growth A value of 95.0 on the BDO employment index indicates no change to employment. This is the first time the index has fallen below this level in three months. Taken in isolation Augusts’ 94.5 score suggests a marginal decrease in employment over the next quarter. The trend over the past three months is certainly indicative of employment growth well below long term average trend growth of 1.0%. We expect the job creation will remain sluggish over the medium term as private sector employment growth is weak, while the public sector is gearing up for significant job shedding. Source: PMI, Bank of England, CBI and the Office for National Statistics
For further details Peter Hemington: BDO LLP, 55 Baker Street, London W1M 1DA Telephone: 020 7486 5888 Fax: 020 7487 3686 E-mail peter.hemington@bdo.co.uk Douglas McWilliams, Charles Davis or Owen James: the centre for economics and business research ltd, Unit 1, 4 Bath Street, London EC1V 9DX Telephone: 020 7324 2850 Fax: 020 7324 2855 E-mail dmcwilliams@cebr.com or ojames@cebr.com
Methodological Notes The BDO Monthly Business Trends Indices are prepared on behalf of BDO LLP by the centre for economics and business research ltd., a leading independent economics consultancy. cebr has particular strengths in all forms of macroeconomic and market forecasting for the UK and European economies and in the use of business survey techniques. The indices are calculated by taking a weighted average of the results of the UK’s main business surveys. It incorporates the results of the quarterly CBI Industrial Trends Survey (and the CBI Monthly Trends Enquiry which is carried out in the intervening months); the Bank of England Agents’ summary of business conditions; and the Chartered Institute of Purchasing and Supply’s Surveys of Manufacturing and of Services. Taken together the surveys cover over 11,000 different respondents from companies employing approximately five million employees. The respondents cover a range of different industries and a range of different business functions. Together they make up the most representative measure of business trends available. The surveys are weighted together by a three-stage process. First, the results of each individual survey are correlated against the relevant economic cycles for manufacturing and services. This determines the extent of the correlations between each set of survey results and the relevant timing relationships. Then the surveys are weighted together based on their scaling, on the extent of these correlations and the timing of their relationships with the relevant reference cycles. Finally, the weighted total is scaled into an index with 100 as the mean, the average of the past two cyclical peaks as 110 and the average of the past two cyclical troughs as 90. The results can not only be used as indicators of turning points in the economy but also, because of their method of construction, be seen as leading indicators of the rates of inflation and growth.